1. About Health Statistics
Costs
The fourth type of health statistic measures the economic and societal costs of health care and poor health. Economic costs of health care like the price of health insurance, factors driving the growth in health care spending, or National Health Expenditure (NHE), are relatively easy to quantify. NHE in 2020 was $4.1 trillion, or $12,530 per person. This accounted for 19.7% of the Gross Domestic Product (GDP) of the U.S.1
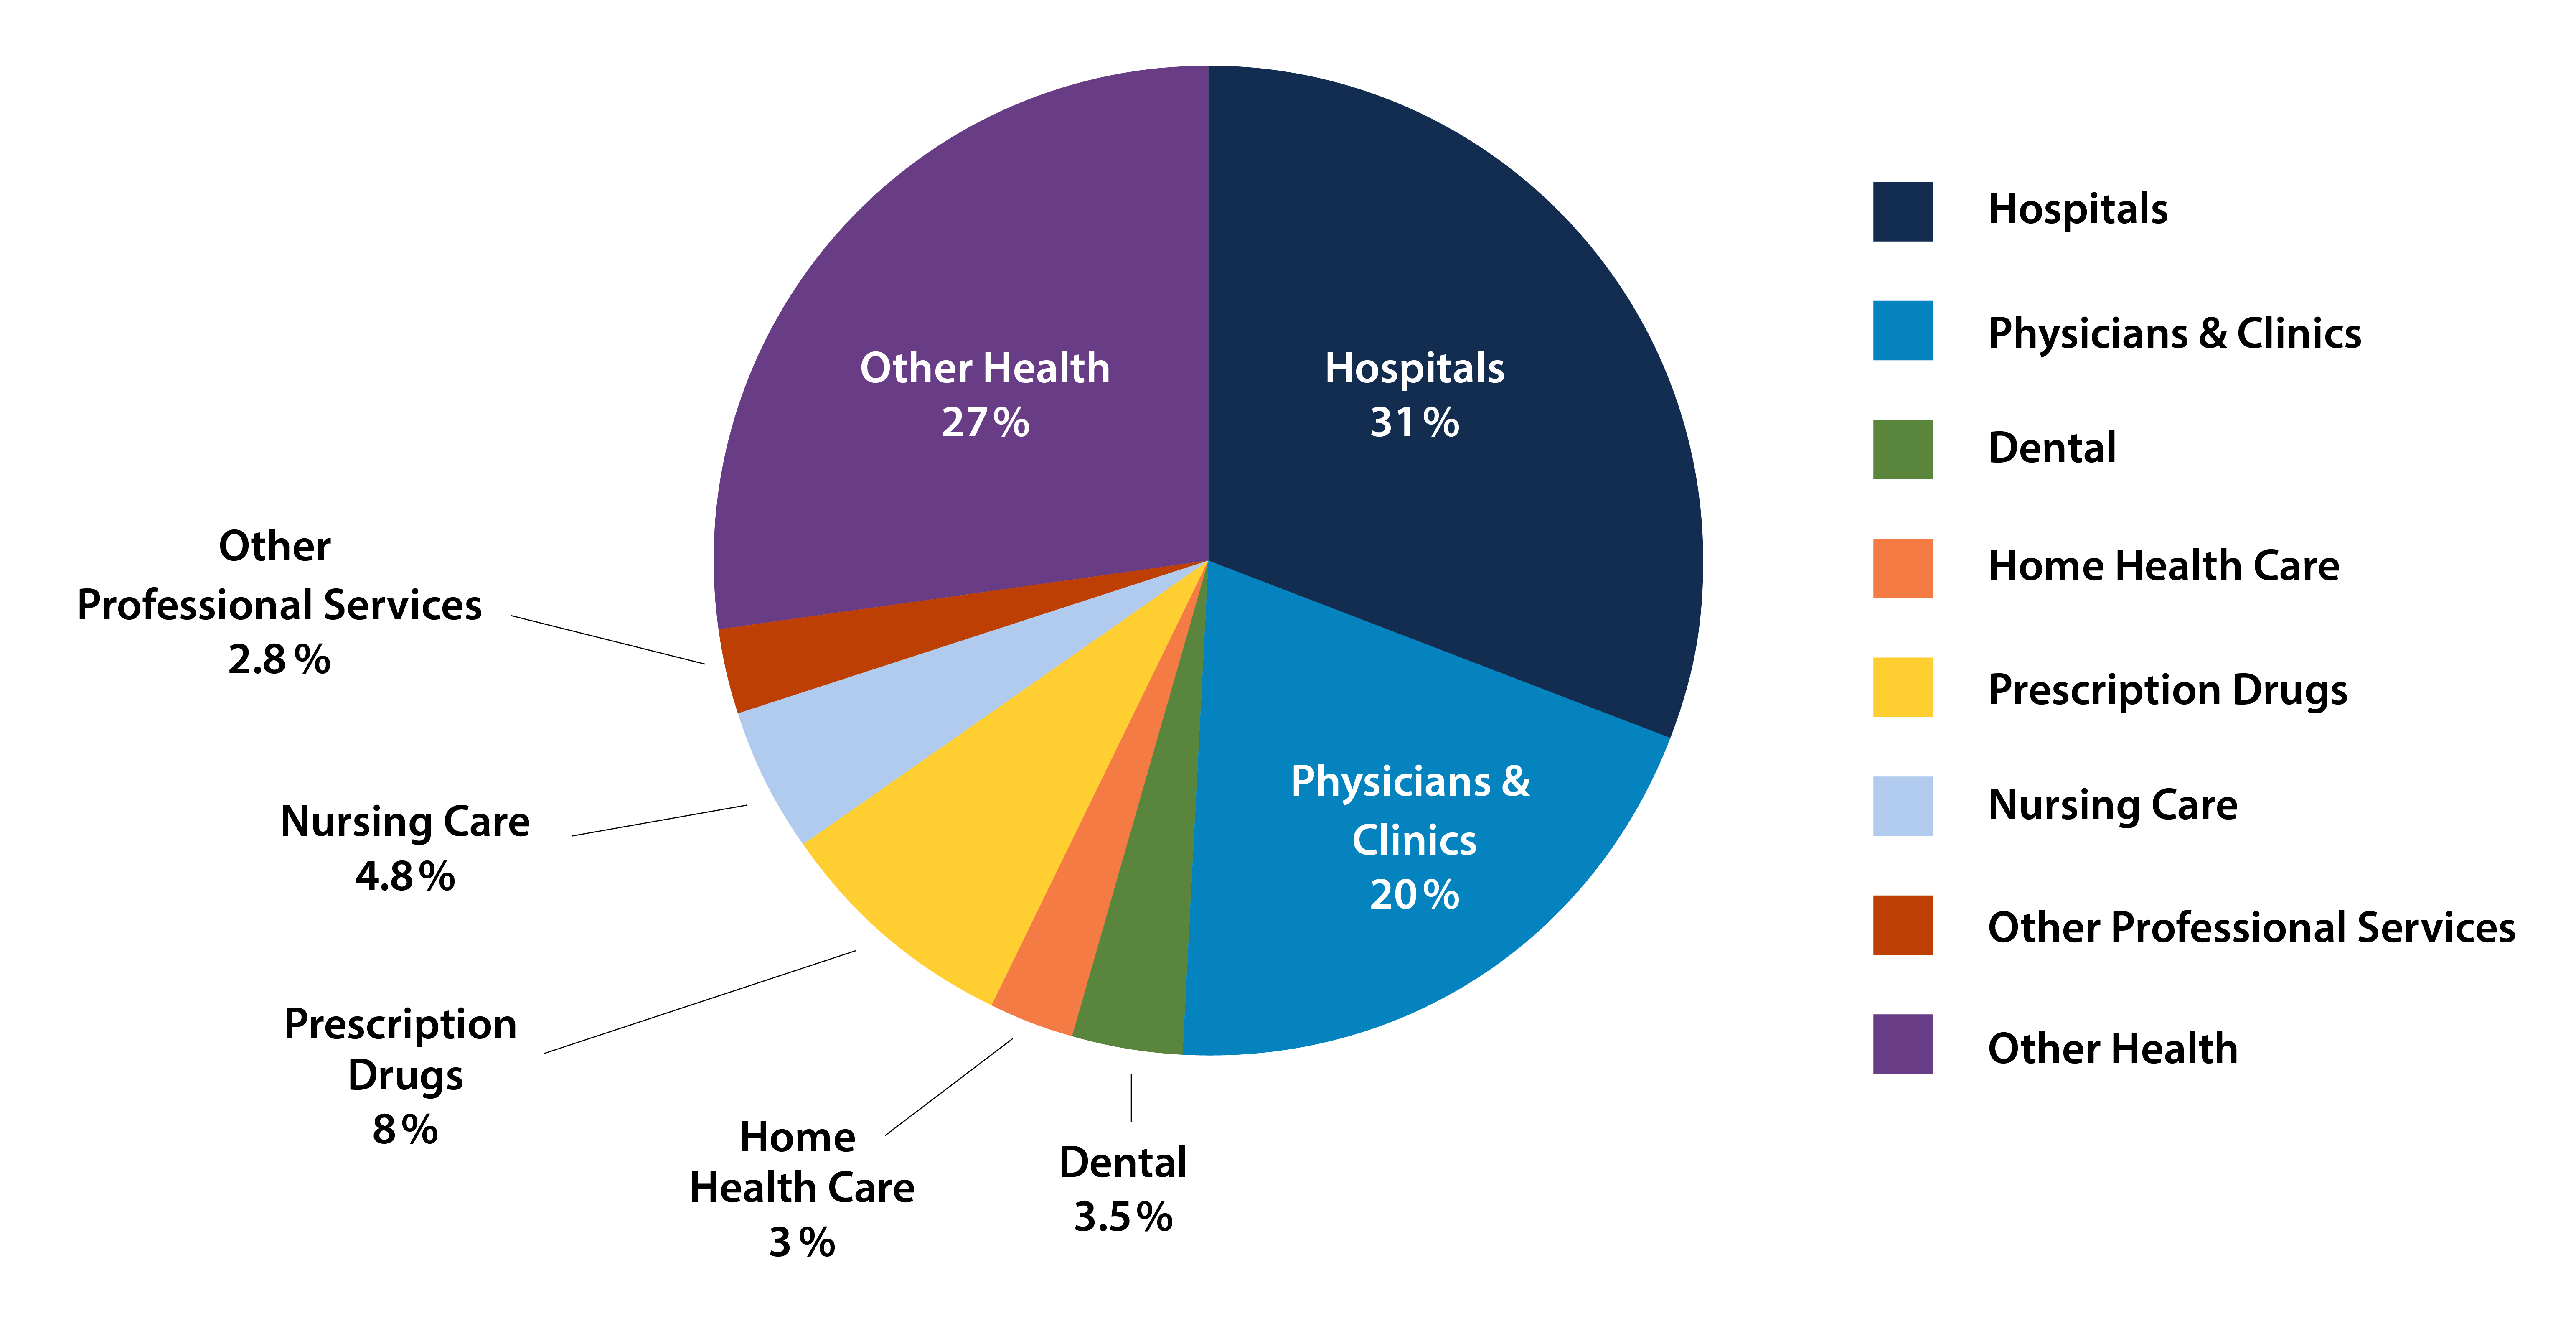
The Centers for Medicare and Medicaid Services (CMS) publicly report on measures of NHE, including age and gender estimates, as well as health expenditures by state of residence and provider. Additional sources for data on health costs are the National Center for Health Statistics of the Centers for Disease Control and Prevention, and AHRQ’s Medical Expenditure Panel Survey (MEPS). This pie chart shows that hospital spending accounted for close to a third (31%) of overall health spending, while physicians/clinics and prescription drugs accounted for 20% and 8%, respectively, of total health spending in 2020.2
Relative contributions to total national health expenditures, 2020
Societal costs of health care and poor health are challenging to quantify, but are still measurable. An example is the cost of reduced quality of life. The Centers for Disease Control and Prevention (CDC) uses a measure called Health Related Quality of Life (HRQOL) to understand “an individual’s or group’s perceived physical and mental health over time”3 through a series of questions called Healthy Days Measures about health status and limitations. These questions comprise the Healthy Days Survey. While many of the measures in the HRQOL index are objective outcomes related to physical health, others are more challenging to measure, like social relationships and spirituality.
Similarly, the World Health Organization (WHO) uses disability adjusted life years (DALY) as an indicator of the overall burden of disease. This measure combines the years of life loss due to early death and years of life loss due to disability to provide an estimate of disease burden that includes both mortality and quality of life (measured as disability).4
Health care spending in the U.S. is much greater than in other countries.5 Because of the high cost of U.S. health care expenditure, health care costs and quality of care have long been used to assess the efficiency of a health care system in decision making that must balance the cost of health care with its potential benefits.6 However, evidence about the relationship between health care costs and quality of care is inconsistent, with many studies suggesting that higher costs are not closely related with higher quality health care in the U.S.7
Increasingly, health care is shifting focus from the volume of services delivered (i.e., number of medical tests or procedures) to the value created for patients, with “value” defined as the outcomes achieved relative to the costs.8 Value-based care and value-based payment models rely on consistent measures of patient outcomes.
1. "Historical: National Healthcare Expenditure, 2020." Centers for Medicare and Medicaid Services (CMS), 2022. Available from: https://www.cms.gov/Research-Statistics-Data-and-Systems/Statistics-Trends-and-Reports/NationalHealthExpendData/NHE-Fact-Sheet
2. Kurani, Nisha, et al. "How Has U.S. Spending on Healthcare Changed over Time?" Peterson-KFF Health System Tracker, 25 Feb. 2022, https://www.healthsystemtracker.org/chart-collection/u-s-spending-healthcare-changed-time/#Percent%20change%20in%20total%20health%20expenditures%20per%20capita,%201980-2020,snd%20in%20the%20Personal%20Consumption%20Expenditure%20price%20index,%201980-2020.
3. "Measuring healthy days: Population assessment of health-related quality of life." Centers for Disease Control and Prevention, Atlanta, Georgia, 2000.
4. "Disability-adjusted life years (DALYs)." World Health Organization, n.d. Available from: https://www.who.int/data/gho/indicator-metadata-registry/imr-details/158
5. Bradley EH and Taylor LA. The American Health Care Paradox. Why Spending More is Getting Us Less. Public Affairs Press: NYC, 2013.
6. Ryan, A.M., and C.P. Tompkins. Efficiency and Value in Healthcare: Linking Cost and Quality Measures. A Paper Commissioned by the National Quality Forum, 2014.
7. Burke, L.A., and A.M. Ryan The Complex Relationship between Cost and Quality in US Health Care. AMA Journal of Ethics, 16(2), 124-130. 2014.
8. Porter, M.E., Larsson, S., and T.H. Lee. Standardizing Patient Outcomes Measurement. New England Journal of Medicine, 374. 504-506. 2016.