Why the Need for Common Data Elements?
Example: Pain Scales
Let’s look at an example of data gathering from healthcare. These are two pain scales:
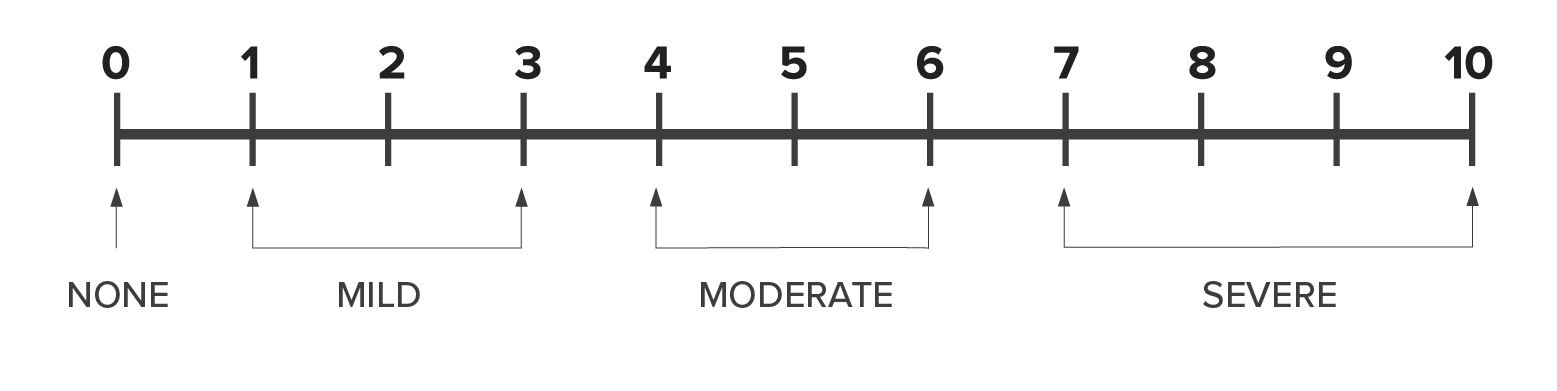
1) 0 - 10 Numeric Pain Rating Scale
2) Categorical Scale
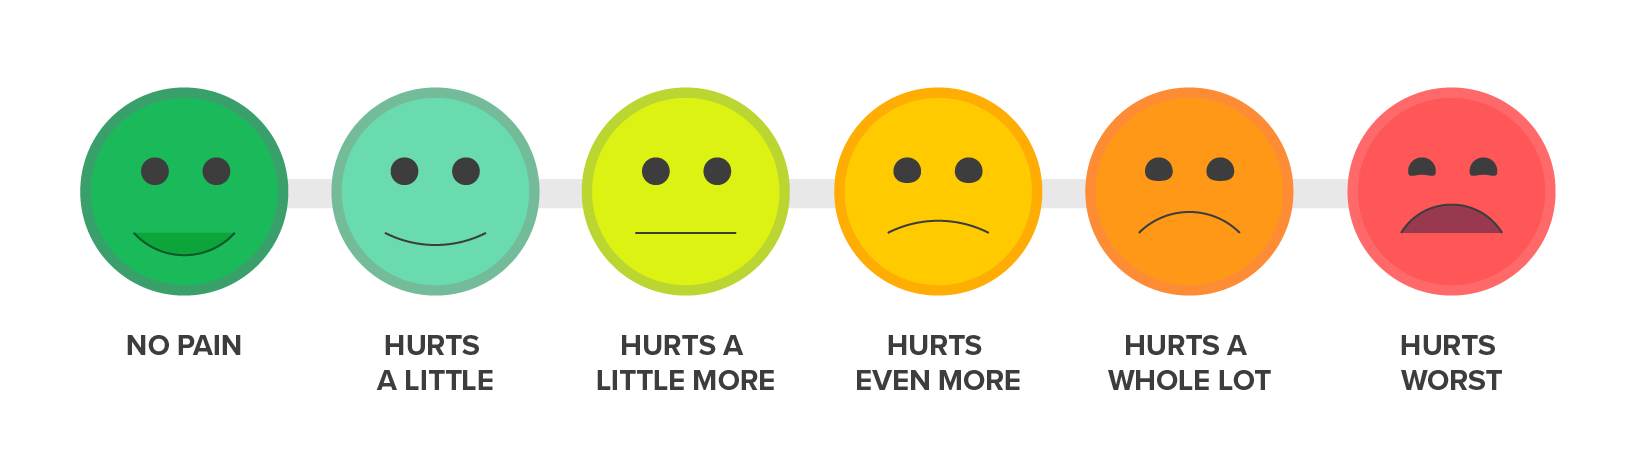
They both ask the patient to self-report their pain severity on a linear scale, and you might even say that these things are more alike than they are different.
Scenario
To demonstrate, consider the following scenario:
You’ve been experiencing some knee pain whenever you put weight on your right side.
Your general practitioner (GP) uses the Numeric Pain Rating Scale, and you rate your pain as 5 (Moderate). But the specialist you are referred to uses the Categorical Scale.
How would you translate your first pain rating to the second scale?
What issues do you notice when trying to do that?

(Image Source: iStock Photos, boggy22©)
There is a problem translating responses between these two scales. One has 11 possible responses. The other has six. What if you were a researcher who wanted to analyze a large set of data, but one data set used one scale and the other data set used the other?