Example: Why don't cats have a sweet tooth?
Designing an Evolutionary Biology exercise with NCBI resources

-
-
-
- Who is the audience?
- Upper-level high school students, college students in intro biology or a first course in evolutionary biology
- What do they need to learn?
- How to use evolutionary trees and sequence data to you formulate and test hypotheses related to cool phenotypes
- What do they need to learn how to do?
- Generate a hypothesis about the genetic basis of a cool phenotype
- Identify what NCBI resources are relevant to the evolutionary biology research question
- Build a simple phylogenetic tree using sequence data
- Identify sequence orthologs related to the phenotype
- Evaluate changes in sequence orthologs that could
- Use visualization tools to support hypothesis and share findings with others
- What is a relevant and interesting story for the audience?
- Evolution of a relatable sensory phenotypes
- What kind of NCBI data & resources are relevant?
- Sequence Analysis Tools
- BLAST alignment tool
- COBALT sequence aligner
- Multiple Sequence Alignment Viewer (Graphics)
- Biological Sequence resources
- Gene
- Nucleotide
- Protein
- Biological structure resources
- Structure
- iCn3D (if time)
- Sequence Analysis Tools
- What workflow will help find the data and provide the information to solve the case study?
- Workflow: See below
- How can they assess that they've mastered the content?
- Opportunities to check work against answer keys
- Practice with other phenotypic examples
- Who is the audience?
-
-
Walk-through the exercise/materials
- Set up: Sign up for an NCBI Account
- Come up with an evolutionary question and plan to test it
- Gather data to build phylogenetic tree
- Use data to build evolutionary tree
- Find gene sequences and map them onto phylogenetic tree
- Identify specific changes to protein sequences and finish the story!
Step 1: Sign up for an NCBI Account
A free solution for organizing your search results and so much more!
In today's workshop, we will be emphasizing the benefits of a free NCBI Account for tasks such as:
- Creating Collections to organize and save your search results so that you can quickly find them later.
- Share a Collection with others.
For today's workshop we assume you have set up an NCBI Account - if you are interested in using one.
If you'd rather not, you can still fully participate in using the NCBI databases and tools, but if you want to save links so that you can easily find them again and share them - you may need to come up with your own way to do this (examples: browser bookmarks, copying and pasting into a document etc). |
Please note that NCBI Accounts are also useful for:
- Saving and automating searches of various databases (both literature & molecular biology).
- Saving your BLAST searches and results longer than without an account.
- Setting your preferred sort mechanism for search results.
- Highlighting search terms in your choice of color to make them easy to find.
- Creating your own custom filters for quick and easy refinement of searches
- Creating your own publication list (My Bibliography)
- Creating Federal BioSketches (NIH, NSF, DoED) from stored information
- For NIH grantees, producing your funded-publication reporting tables for Annual and Final Reports.
- and you can keep track of everything – right on your My NCBI dashboard!
Step 2: Come up with an evolutionary question

Have you ever noticed…
That you have a bigger sweet tooth than your friends?
Your dog seems more interested in your candy than your cat?
The recommended food for hummingbirds is sugar water?
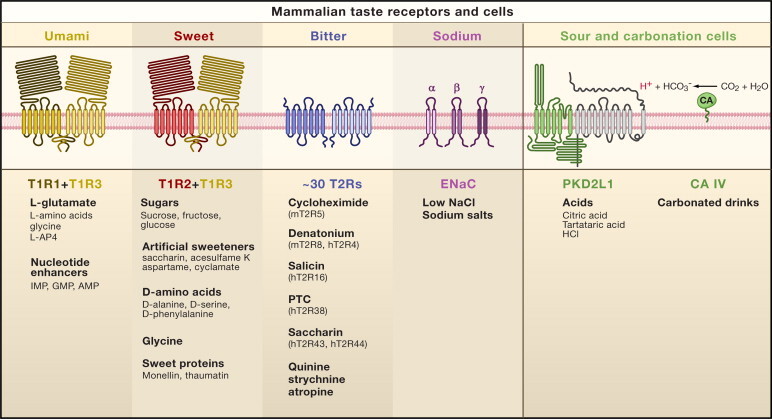
And wondered...why is this? is there a genetic component to the ability to taste and seek out sugar?
T1R1: https://www.ncbi.nlm.nih.gov/gene/80835/
T1R2: https://www.ncbi.nlm.nih.gov/gene/80834
T1R3: https://www.ncbi.nlm.nih.gov/gene/83756

Make a hypothesis: Now that we know which genes are responsible for perception of sweet/carbohydrate tasting, do you think the same holds true for other animals? How can we test this hypothesis?
Step 3: Gather sequence data for building an evolutionary tree
To build an evolutionary tree, we are going to gather gene sequences from a wide set of vertebrates, including our species of interest (house cat and hummingbird). Scientists often use barcoding sequences (standardized sections of DNA) to identify specimens and determine relationships between species.
One common choice of barcoding sequence is a 600bp portion of the cytochrome oxidase gene. For ease of database searching today, we are going to use the full mitochondrial genome sequence for each species. Mitochondrial phylogenies are also common practice. Luckily, we don't need to do the sequencing ourselves, and can instead search the NCBI Nucleotide database for these mitochondrial genomes and then save the records to a collection in our NCBI account.
A. Saving a sequence record to an NCBI Account collection
- Go to the page for the ruby-throated hummingbird mitchondrial genome sequence (Accession NC_010094.1)
- Once you are there, click "Send to" in the top left corner of the page.
- Leave "Complete Record" selected and Choose Destination set to "Collections". Click "Add to Collections"
- Choose "Create new collection" and name it something that makes sense, like "Sweet Mitochondrial Genomes" and Press "Save"
- From now on, you can add all mitochondrial sequences to that collection by choosing "Append to existing collection"
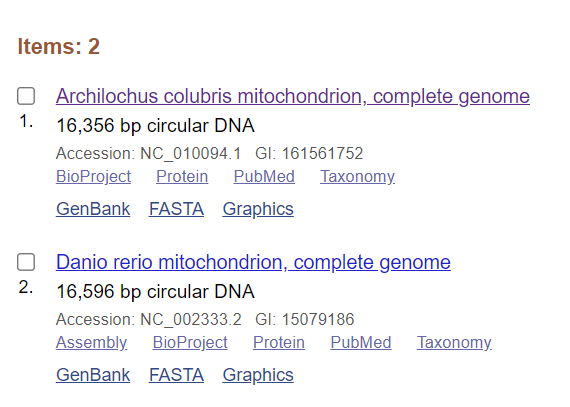
Check your work: To check that both of these sequences were saved to the collection, Go to your NCBI Account Dashboard.
- From nearly any NCBI page, simply go to the top right corner of the whole page, click your username -> Dashboard.
- Under Collections, click on the name of the collection.
- The following two items should now be in your collection:

If you don't already have a link to your sequence, you can search for it in the NCBI Nucleotide database, which is a collection of the millions of genome, gene and transcript sequences that users have submitted over the years. Here you will build the rest of your mitochondrial dataset by searching this database, starting with the human mitochondrial genome.
- Navigate to the NCBI Nucleotide Database: NCBI Nucleotide database
- In the search bar type "Human mitochondrial genome" and click Search
- A result box like this will pop up - click the main title "Human mitochondrial reference genome"
- Just like you did above, send this record to your "Sweet Mitochondrial Genomes" collection
-
- Ruby-throated hummingbird - Archilobus colubris - tasting (DONE)
- Common swift - Apus apus - non-tasting
- Little blue penguin - Edyptula minor - non-tasting
- African ostrich - Struthio camelus - non-tasting
- Grey parrot - Psittacus erithacus - non-tasting
- Zebra finch - Taeniopygia guttata - non-tasting
- Human - Homo sapiens - tasting (DONE)
- House mouse - Mus musculus - tasting
- Domestic cat - Felis catus - non-tasting
- Dog - Canis lupus familiaris - tasting
- Little brown bat - Myotis lucifugus - tasting
- Cattle - Bos taurus - tasting
- Outgroup: Zebrafish (DONE)
Step 4: Infer evolutionary tree and use it to look at patterns
Once all thirteen of the above sequences have been gathered, you have what we need to build a tree of the relationships between the species and use it to refine your hypotheses. We are going to use NCBI's BLAST tool to align the sequences, and then visualize the output as a tree using Tree Viewer.
A. Send Data from Collection to BLAST
- From nearly any NCBI page, simply go to the top right corner of the whole page, click your username -> Dashboard.
- Under Collections, click on the name of the collection.
- Once inside collection – send to -> Analysis tool -> BLAST
- Click “Align two or more sequences”
- Copy and paste the list of sequences IDs into the "Enter Subject Sequence" box too
- Make job title something informative: "MitoGenomes"
- Choose “more dissimilar sequences” to use a version of BLAST that is good for cross-species comparisons
- Click "BLAST"!
C. Examine output and export the tree
There is a lot to explore on the results page, and you can learn a lot more from past BLAST workshops but for today's exercise, we are going to click on "Distance tree of results". Adjust to "Neighbor Joining"
Your result should look something like the following - Question: what are some improvements we could make to help us understand results?

For one thing, it might help us if we could render the labels with the species common names instead of the full scientific names:
- Choose Tools -> “Edit labels” Select common names
- The only “scientific name” left should be the hummingbird, which may be missing common name data - we can always re-label the sequences in other software program.
Save the results:
- Tools -> Download PDF, which can be pasted into a slide or document
- Tools -> Download Newick file (to import into other tree-visualization software as an extension!)
- Can also take a screenshot in a pinch!
- What is the best bird species for comparison with the hummingbird if we want to learn how their sequences evolved?
- You could probably already guess this, but what is the best animal for comparison with domestic cat?
D. Map trait onto the tree
Here is a clean version of the tree, which I edited in third party software. As an exercise, students can fill in the remaining taxa. Then, on the branch leading to each taxa, mark the presence/absence of data from the tree.

Discussion: What is another trait you could map to this tree?
Answer key for mapping trait can be found here.
Step 5: Tying things together: Find orthologs and map presence/absence on our tree
Let's move on to look at the actual basis of sweet tasting perception. As a reminder, according to the paper we read at the beginning of this lesson:
"In vertebrates, sweet and savory (“umami”) tastes are sensed by G protein–coupled receptors (GPCRs) termed T1Rs. Most vertebrates have three T1Rs, with the T1R1-T1R3 heterodimer mediating umami taste and the T1R2-T1R3 heterodimer mediating sweet taste. Human T1R2-T1R3 detects carbohydrates and artificial sweeteners (10), and knockout mice lacking T1R2 or T1R3 have defective sweet taste perception.“
Now, we are going to be tying the genetic basis of sweet perception together with the patterns of trait evolution we mapped above. This will help us test our hypothesis - DOES each animal that can perceive sweetness have copies of both the T1R2 and T1R3 gene family? To to this, we need to 1) Find whether or not each species in our tree has an ortholog (related sequence) for each gene, and 2) Label this presence/absence on our tree.
We are going to take advantage of pre-computed NCBI Orthologs to do this! These have been calculated for many animals and more orthologs are being calculated and added all the time.
To find Orthologs of a human gene, we can start back on the Human Gene page for our sequence of interest:Using T1R2 as an example: Under Summary, find Orthologs and click the "All" link to end up on this page of e.NCBI Orthologs of the Human T1R2 gene Then, we can take advantage of Taxonomy-based browsing.
To check whether or not Bats have a T1R2 sequence ortholog, you can:
- Use what you know about animal relationships: Tetrapods -> Mammals -> Placentals -> Bats
- Use the Taxonomic search box to check directly!
- Either way, we see that bats do have orthologs of this sequence. We can check YES next to our bat species for T1R2.
On your own or in groups: Using the search strategies above, complete the following table or otherwise keep track of which species have orthologs of each sequence.
| Organism | T1R2? | T1R3? |
| Hummingbird | ||
| Swift | ||
| Penguin | ||
| Ostrich | ||
| Parrot | ||
| Finch | ||
| Human | ||
| Mouse | ||
| Cat | ||
| Dog | ||
| Bat | YES | |
| Cattle |
Note:
It is okay if you can't find the exact species match - if the broader category of organism (i.e. bats, hummingbirds) has a sequence we can mark that as YES. Sometimes different species have different representation in different databases, and we don't need to worry about those details for the purposes of this exercise.
Once you have that data, you can also add it to the tree where you have mapped the trait - are there any mismatches between trait and the presence/absence of one of the receptor genes??

Hint:
Almost all mammals, including dogs, have the ability to detect sugars (think about ice cream – yum!). Why can’t cats (big AND small!) do this too?
All other birds have lost the ability to taste sugars, due to the loss of one of the T1R genes. How can hummingbirds detect the sugar in the flower nectar that they eat?
Step 6: Tying things together - specific genetic changes
Through our hard work, we have found some specific exceptions to the idea that presence/absence of the gene
A. Looking for specific changes between cat and dog T1R2 and T1R3 genes
T1R2 - Starting on the NCBI Orthologs of the Human T1R2 gene page again.
- See “canis lupus familiaris” sequence in first result table. Select checkbox and click “Add to Cart”.
- Use Taxonomy search function and do the same for “domestic cat”
- Go to cart -> Align -> One Sequence per gene
- You will be taken to COBALT aligner - go ahead and click through
- View alignment and customize view - share link if you want!- Mine looked roughly like this: What are some differences?

On your own: Align the cat and dog T1R3 sequences to see if there are also major changes.
Link to one possible alignment view: https://www.ncbi.nlm.nih.gov/projects/msaviewer/?anchor=-1&coloring=cons&key=vAMq0twBCyAnLz0nDD4DKVBUUlVaV3ZdfkVwb-VhHi9LGVrF9Z3E8mBI6jG_LeY19B2jHOAC8BPqCfoWzDv1OdUJ8w&track_config=protein_default&columns=d:120,b:55,x:17,aln,e:55,o:150
Of note, these changes match previous research comparing cat and dog taste receptors!
From Xia et al. 2006
B. Do humans have within-species variation?
Thus far, we have focused on major species-level differences in whether or not. Can smaller changes within the human species help account for the differences between how big a sweet tooth each of us have?
We can begin to answer this question by going back yet again to the T1R2 human gene page, and scrolling until we find Bibliography. The short answer is YES there is meaningful human variation in this gene!

Explore some of these publications and the rest of this Gene Page on your own for more information!
C. Opportunities for science communcation:
Today we have gone from observation -> evolutionary hypothesis -> gathering data to test hypothesis -> Looking at specific genetic chanages. One final step in your lesson plan would likely be to have students communicate these findings. Here are a few of my suggestions to start off our discussion:
- Have students think about how they would tell a sibling about cats and dessert preferences
- Pick the two most important figures and create custom versions to include in short presentation
- Your idea here?
D. Practice on your own: How have hummingbirds re-evolved the ability to taste sugar?
We have all of the tools and data necessary, and information about some genetic changes can be found in this publication!
BONUS: Link to poster about creating teaching examples!
Last Reviewed: July 17, 2024


