1. About Health Statistics
Conditions
Health conditions may be the most common type of health statistic. There are two ways to measure health conditions: the incidence and the prevalence of the disease.
Incidence
Incidence refers to the number of new cases of disease in a population.
For an example of incident risk, let’s look an example using HIV cases. The global population in 2021 was 7.9 billion2. According to the World Health Organization (WHO), the number of people who became newly infected with HIV at the end of 2021 was 1.5 million3. Based on this information, we can calculate the global incidence risk of HIV in 2021 was 19.0 cases per 100,000 population (1,500,000 / 7,900,000,000).
If, for example, we wanted to know the incidence rate of HIV in the United States from 2000 to 2020, we could calculate the number of new HIV cases in the population at risk for developing HIV for that given time period. Because some people in the United States may not be at risk of developing during HIV entire period (for example, if they die during the time period), the incidence rate will include only the time the person was at risk. This means that instead of showing the incidence as ‘per 100,000 people’ as with incidence risk, it would be presented as ‘per 100,000 person-years.’
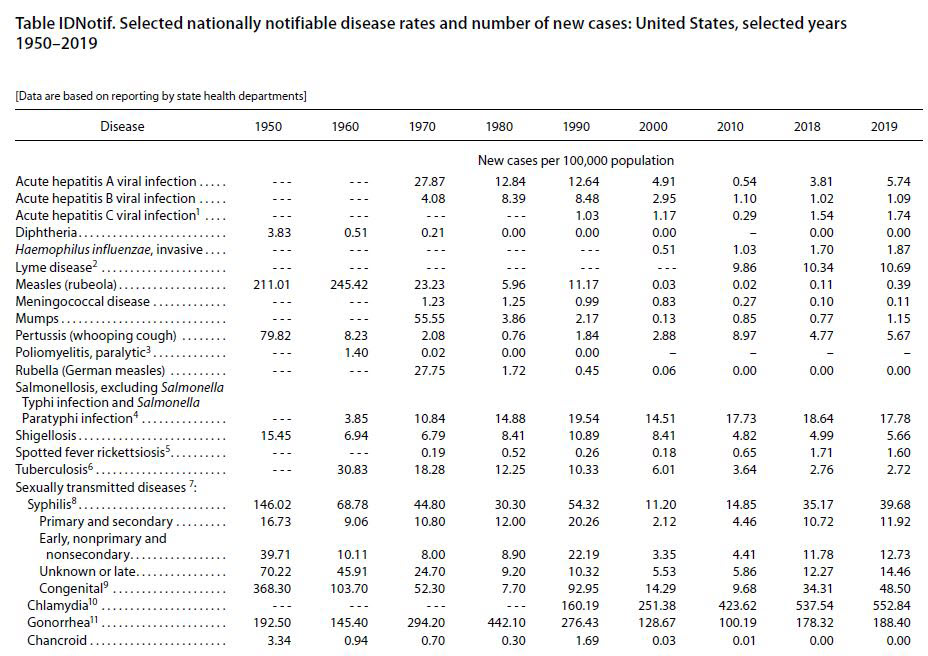
The image below shows the incidence of different diseases in the United States from 1950 to 2019.4
Prevalence
Prevalence is the proportion of a population with a specific disease or condition.
To better understand this concept, let’s continue using the HIV example. The World Health Organization (WHO) reported "approximately 38.4 million people were living with HIV at the end of 2021." The global point prevalence of HIV in 2021 is 486.1 per 100,000 population (38,400,000 / 7,900,000,000). This means that the total of new and pre-existing cases of HIV in the world was 486.1 for every 100,000 people.6 Because point prevalence reflects the total number of people with a disease at a point in time, prevalence may actually increase even if incidence risk decreases or remains the same for a given illness. This generally occurs if people begin to live longer with a disease.
Period prevalence is similar to incidence rate in that it looks at a time period of interest, rather than a point of time. For our HIV example, period prevalence would be the rate of cumulation of new and pre-existing cases of HIV expressed in person-years.
Incidence and prevalence estimates may also be presented as counts of the number of new or total cases of an illness in the population at risk. For instance, an additional way of expressing the global prevalence of HIV in 2021 is by citing the number of people living with HIV in the world in 2021, which is 38.4 million people. Numbers, or counts, do not relate to the size of the overall population. Therefore, they cannot be used to compare the occurrence of health events across different populations or groups.
Morbidity and Mortality
When using health statistics, it is important to consider how to express information for a particular audience and purpose (percentage, risk, rate, count). Percentages and rates/risks are useful because they put numbers into context and provide standard measures that can be compared across populations.
Incidence and prevalence represent measures of morbidity, or the disease state (illness) of a population, and mortality, or the amount of people who die from a specific disease. Both morbidity and mortality are measures of disease burden.
Although related, morbidity and mortality measure different aspects of disease burden. When using health statistics to report on disease burden, it is important to report the measure that best answers the research question of interest.
For example, the incidence rate of prostate cancer in the United States from 2015 - 2019 was 112.7 cases per 100,000 men per year.7 However, mortality rate for the same period was 18.9 per 100,000 per year. In this example, the mortality and incidence rates when reported alone provide a very different picture of the burden of disease. Together though, they indicate that while many men are diagnosed with prostate cancer relatively few men die from prostate cancer.
1. "Basic Statistics: About Incidence, Prevalence, Morbidity, and Mortality - Statistics Teaching Tools." New York State Department of Health, n.d. Web 1/24/2017
2. United Nations. (n.d.). World Population Day. United Nations. Retrieved from https://www.un.org/en/observances/world-population-day#:~:text=In%202011%2C%20the%20global%20population,and%2010.9%20billion%20in%202100
3. "Key Facts HIV" World Health Organization (WHO), July 2022. Web 7/28/2022
4. National Center for Health Statistics. Health, United States, 2020-2021: Table IDNotif. Selected nationally notifiable disease rates and number of new cases: United States, selected years 1950–2019. Hyattsville, MD. 2021. Available from: https://www.cdc.gov/nchs/hus/data-finder.htm.
5. "Lesson 3: Measures of Risk, Section 2: Morbidity Frequency Measures." Principles of Epidemiology in Public Health Practice. Centers for Disease Control and Prevention, 2012. Available from: https://stacks.cdc.gov/view/cdc/6914/cdc_6914_DS1.pdf
6. "Key Facts HIV" World Health Organization (WHO), July 2022. Web 7/28/2022
7. "Cancer Stat Facts: Prostate Cancer" SEER. National Cancer Institute. Available from: https://seer.cancer.gov/statfacts/html/prost.html.