2. Common Terms and Equations
Age-Adjustment
Sometimes, health statistics are used to compare different groups to assess how healthy two different groups of people are or how healthy a certain group is during two different time periods. However, different groups or even the same group at different time points may not be comparable due to various factors like population size, and confounding variables such as age or sex. To compare these different groups accurately, health statistics need to be standardized or adjusted.
For example, since older people are more likely to get ill, and younger people are more likely to injure themselves, age-adjustment (or age standardization) can make studies more accurate. Although age-adjustment is the most common type of adjustment, health statistics can be adjusted using other factors like sex as well.
Age is the most common confounding variable that is adjusted or controlled for in studies. As stated earlier, a confounder is a variable that is related to both the independent and dependent variables. Without adjusting for a confounder, the effects of the confounder are mixed in with the effects of the independent variable of interest. If that’s the case, then the conclusions drawn from the statistics may be inaccurate.
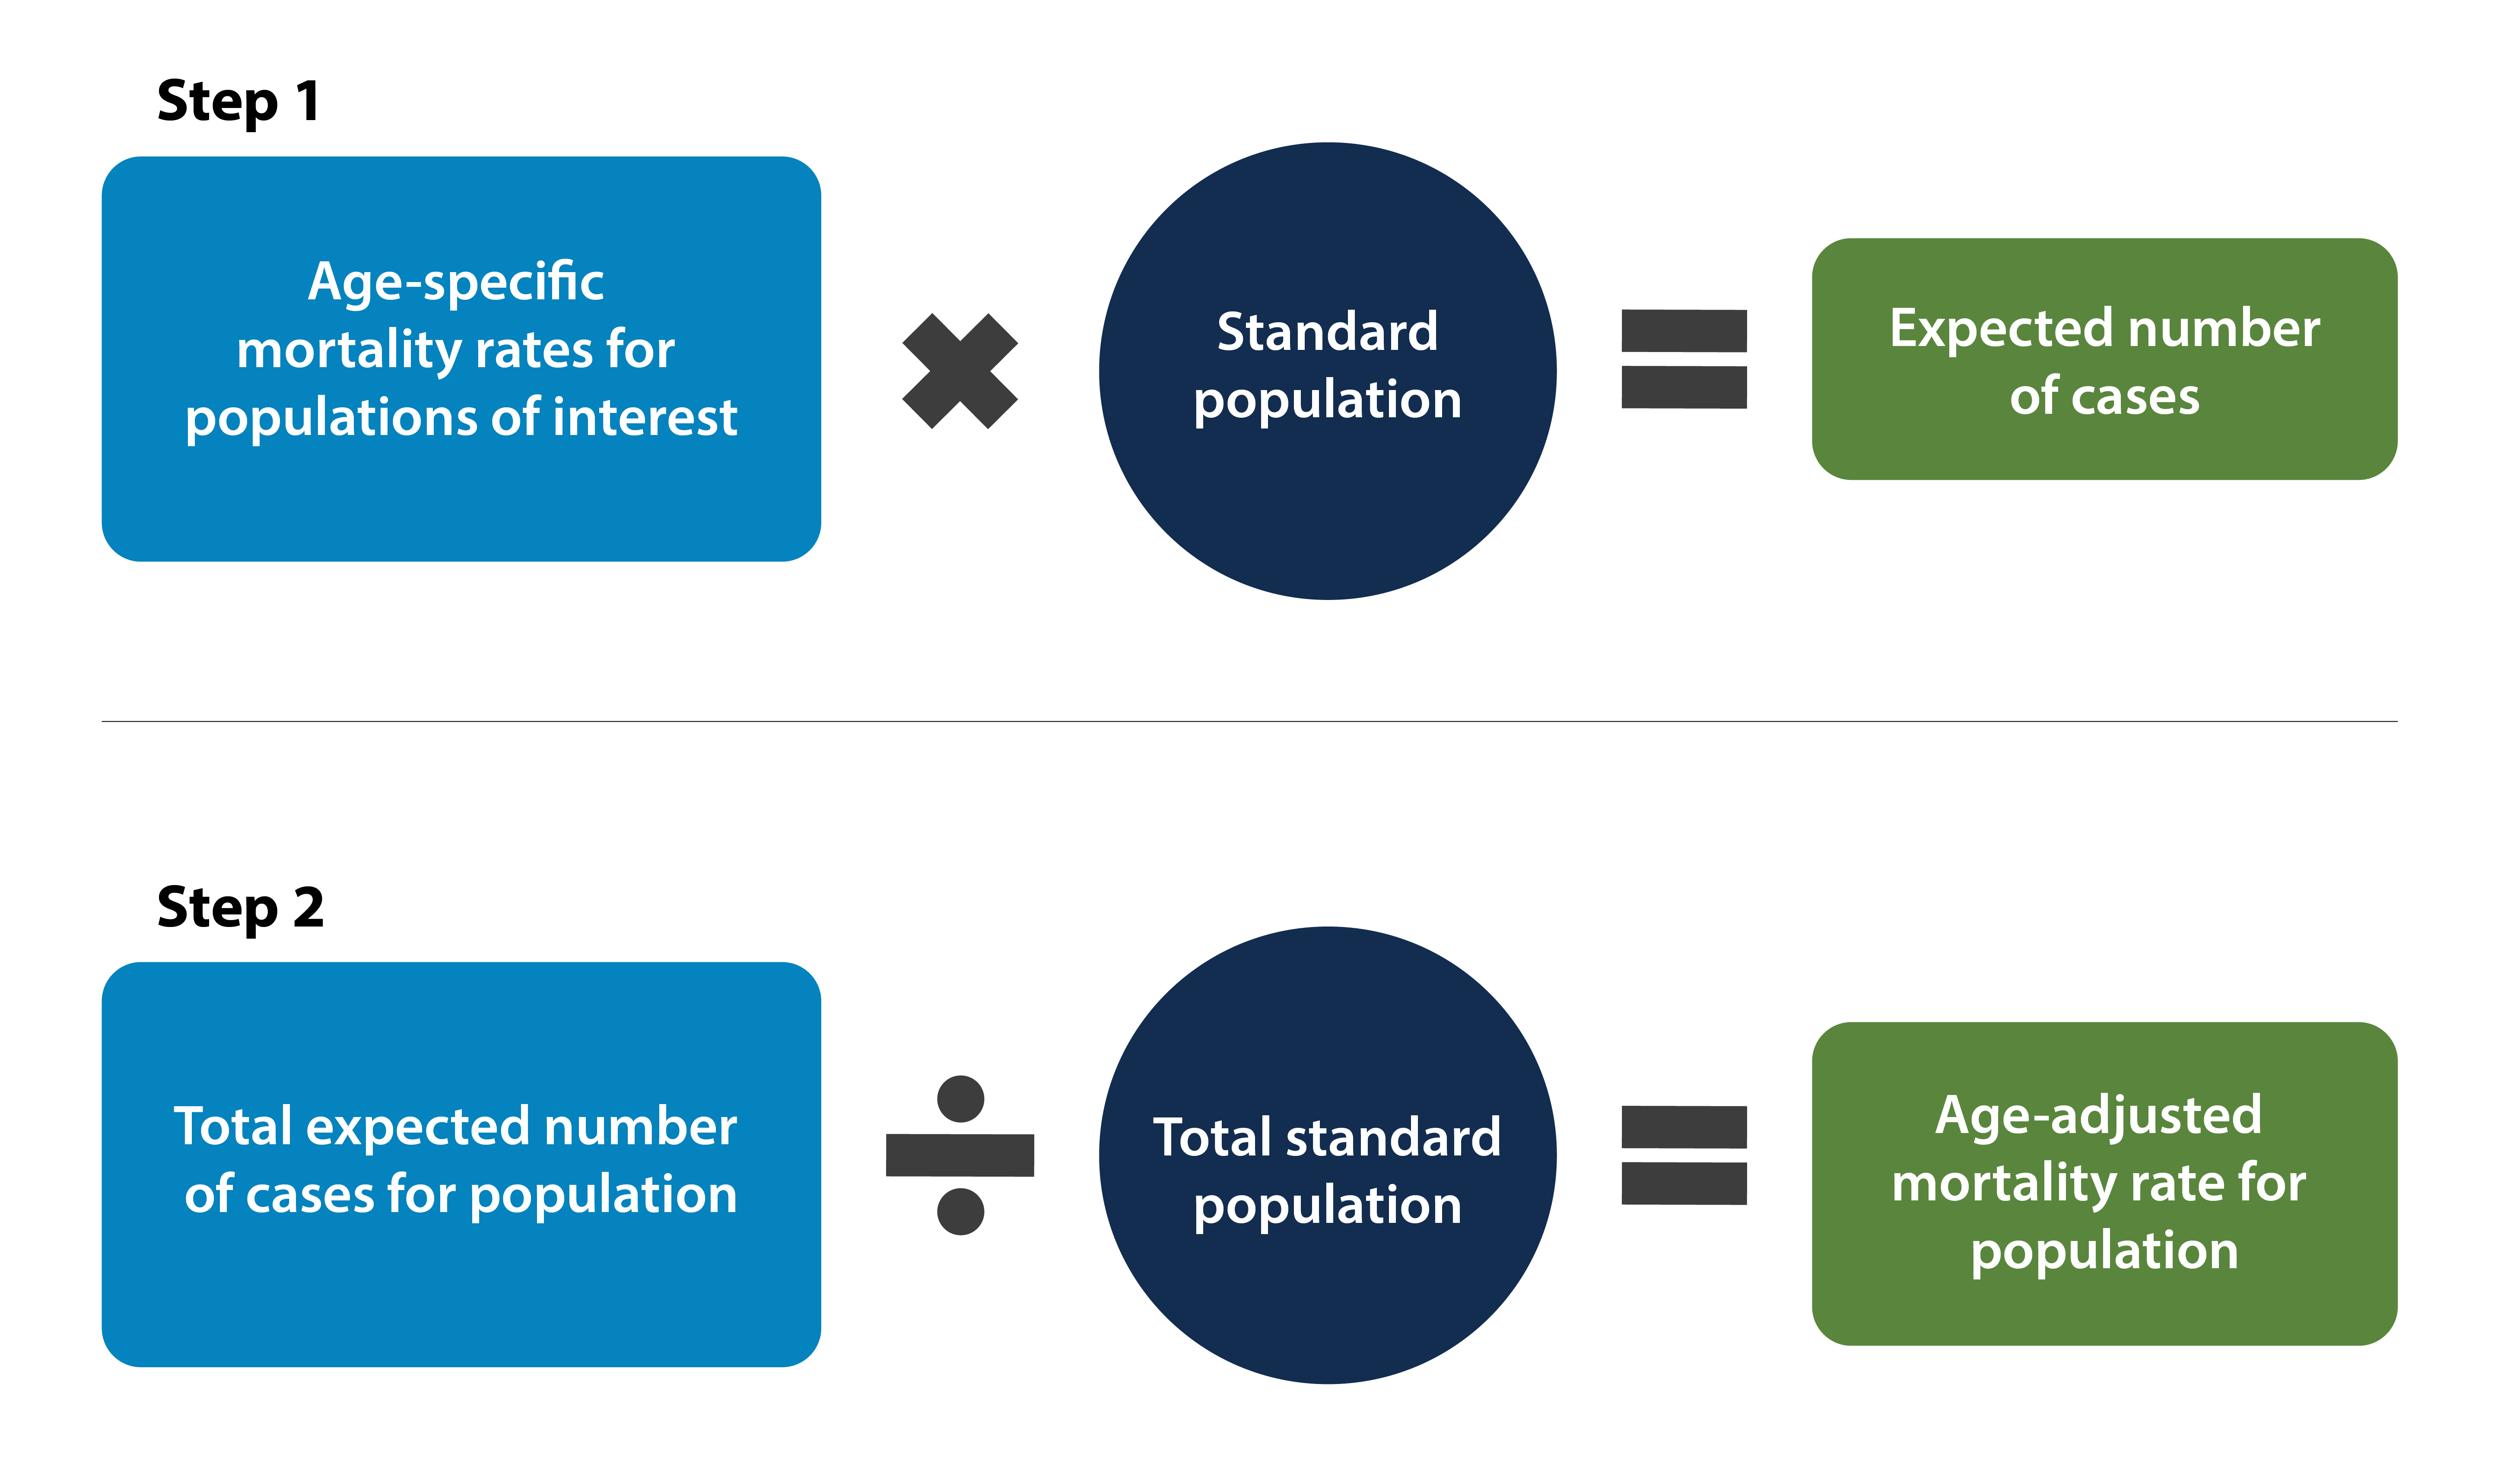
Direct Standardization
To be able to better compare groups while adjusting for age (or any confounder), we use a process called direct standardization. When we use direct standardization, we assume both groups have the same number of people. Then we calculate the expected number of deaths and death rates in both groups. By doing this, the two populations can be directly compared, independent of the age distribution of each group. With direct standardization, the specific death rates per group (usually age) must be known. Otherwise, another method is used. For more information on standardization, view "Easy Way to Learn Standardization: Direct and Indirect Methods."
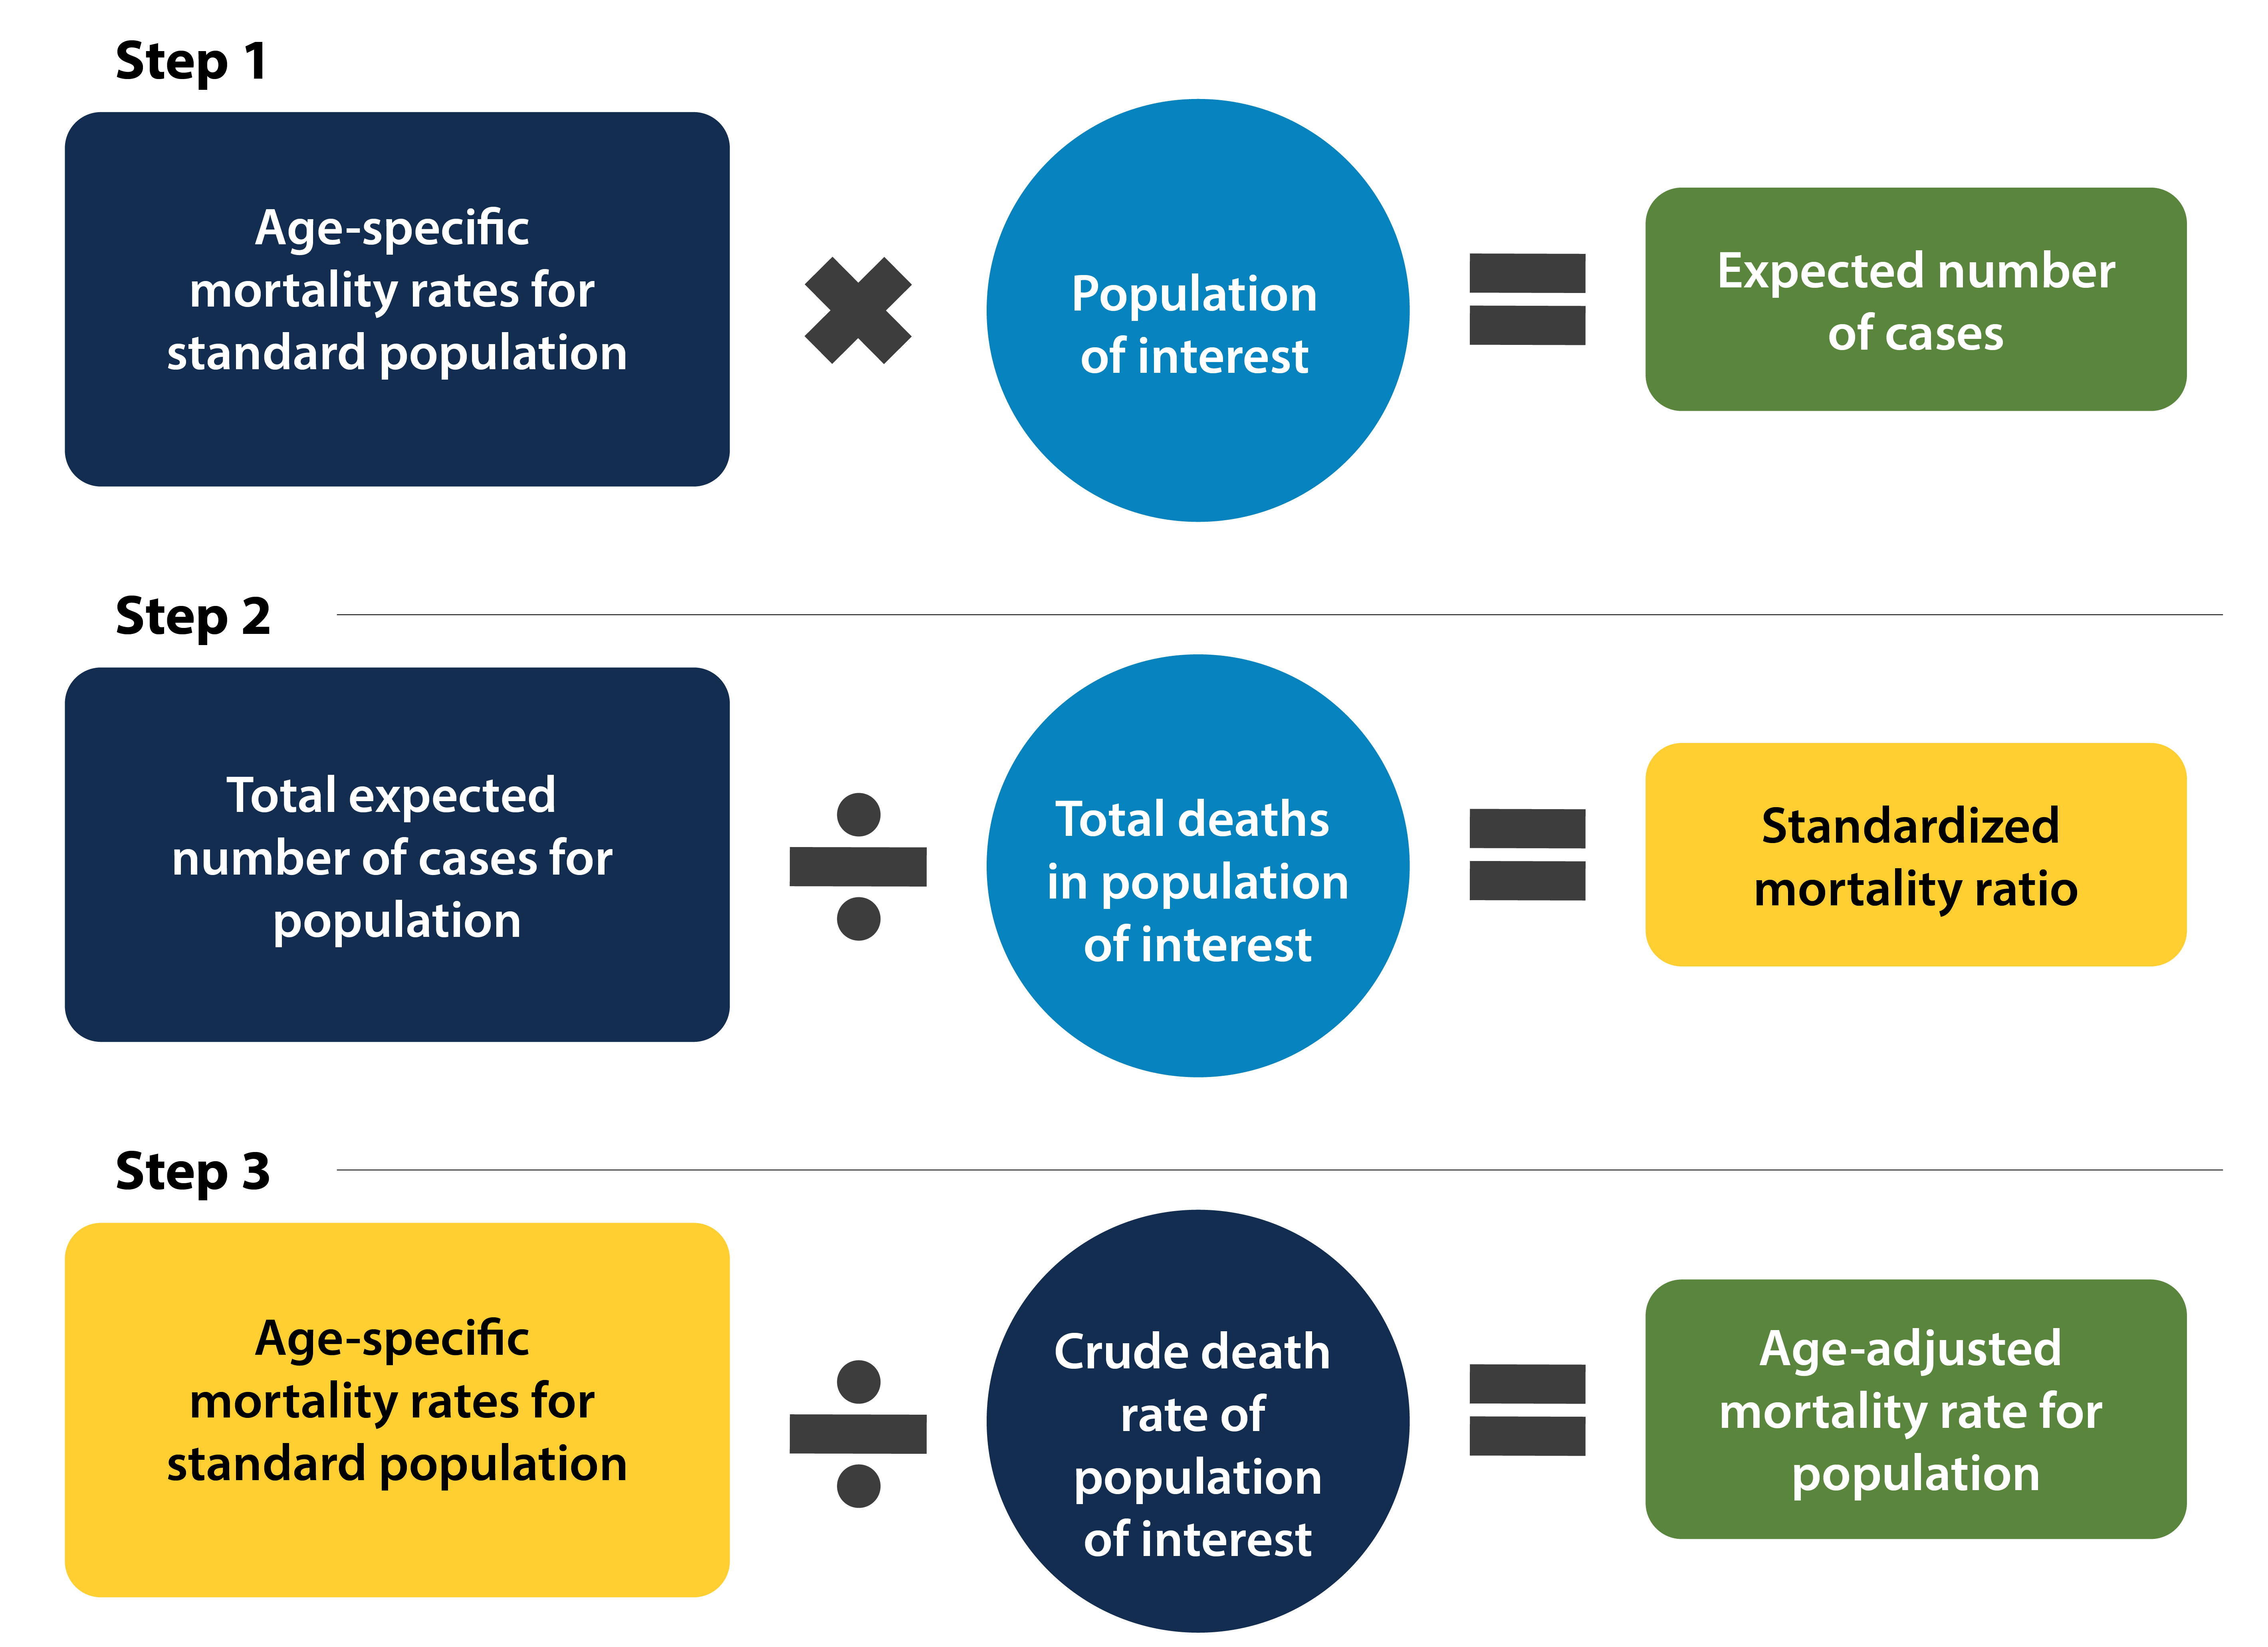
Indirect Standardization
If the age-specific mortality rates (these are used to calculate expected deaths) for the population of interest are not known, researchers can use indirect standardization, which requires only the observed deaths and age structure of the population of interest. Direct standardization is generally preferable because the populations of interest are compared to just one standard population (usually the U.S. Census population). Indirect standardization, however, can be preferable with small sample sizes in different age groups.1
It is important to remember that age-adjusted rates are not the actual rates of death or disease in the population – the actual unadjusted rates are called crude rates. Age-adjusted rates are only useful for comparisons to other populations.
The table below shows the expected death rate and number of deaths in a standardized population, which provides the age-adjusted death rates. Age-adjusted rates were calculated by dividing the expected number of deaths by the population (standard) and multiplying by 1,000. The expected number of deaths were computed by multiplying the age-specific death rates of the study population by the standard population size of that age group. For instance, the expected number of deaths for the <1 yr White age group = (13.3*15,000)/1000).
Expected Number of Deaths in Standardized Populations and Age-Adjusted Death Rates
|
|
White |
Black |
||||
|---|---|---|---|---|---|---|
|
Age |
Rate per 1,000 |
Population |
Expected no. of deaths |
Rate per 1,000 |
Population |
Expected no. of deaths |
|
<1 yr |
13.3 |
15,000 |
200 |
19.7 |
15,000 |
295 |
|
1–4 yr |
0.8 |
50,000 |
40 |
1.7 |
50,000 |
85 |
|
5–17 yr |
0.5 |
150,000 |
75 |
0.6 |
150,000 |
90 |
|
18–44 yr |
2.5 |
325,000 |
800 |
3.7 |
325,000 |
1202.5 |
|
45–64 yr |
18.0 |
210,000 |
3,780 |
25.0 |
210,000 |
5,250 |
|
>65 yr |
70.0 |
200,000 |
14,000 |
77 |
200,000 |
15,400 |
|
Total |
24.8 |
761,000 |
18,895 |
29.3 |
761,000 |
22,322.5 |
1. "Population Analysis for Policies and Programmes: Comparison of Direct and Indirect Standardization." United Nations Population Fund (UNFPA), London School of Hygiene and Tropical Medicine and University of London, n.d. Web 5/26/2016. http://papp.iussp.org/