2. Common Terms and Equations
z-score
If a student in the class, Student A, wanted to determine how many standard deviations away from the mean their score was, they would need to calculate a z-score:
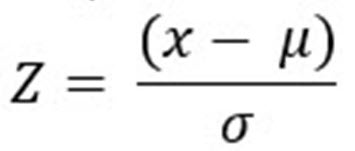
In this formula, x is the given data point (Student A’s score) from the data set, µ is the mean, and σ is the standard deviation. Take the height of 80 inches as an example:
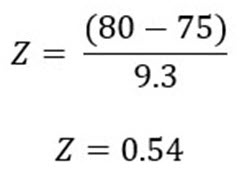
The equation indicates that Student A’s height of 80 inches was 0.54 standard deviations above the mean. What’s useful about the z-score is it can be used to determine the probability of being above or below a given data point.
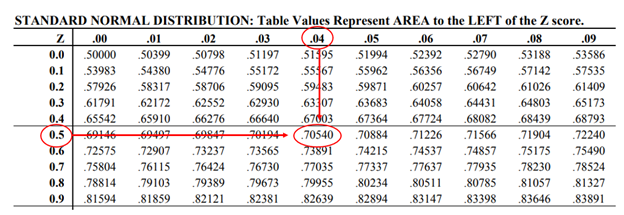
For example, the z-score of 0.54 can be located along a z-table1 (above), which illustrates what percentage is under the distribution curve at any given point. The z-score of 0.54 corresponds to 0.7054 on the z-table. This means that student A is taller than 70.54% of the class and is shorter than 29.46% of the class. Another way to say this is that Student A had a 29.46% chance of being at least 80 inches tall.
1. "Standard Normal Distribution Table." University of Arizona, www.math.arizona.edu/~rsims/ma464/standardnormaltable.pdf.