2. Common Terms and Equations
Sampling
It is impossible to study every person in a large population. Instead, researchers study a sample to make estimates about the total population.
A population in the context of statistics refers to a complete set of items (such as people, events, households, institutions, or something else) that are the subject of research. The sample is the sub-set of data taken from the population of interest or target population.
A sample is collected from a sampling frame, or the set of information about the accessible units in a sample. Again, these units could be people, events, or other subjects of interest.1
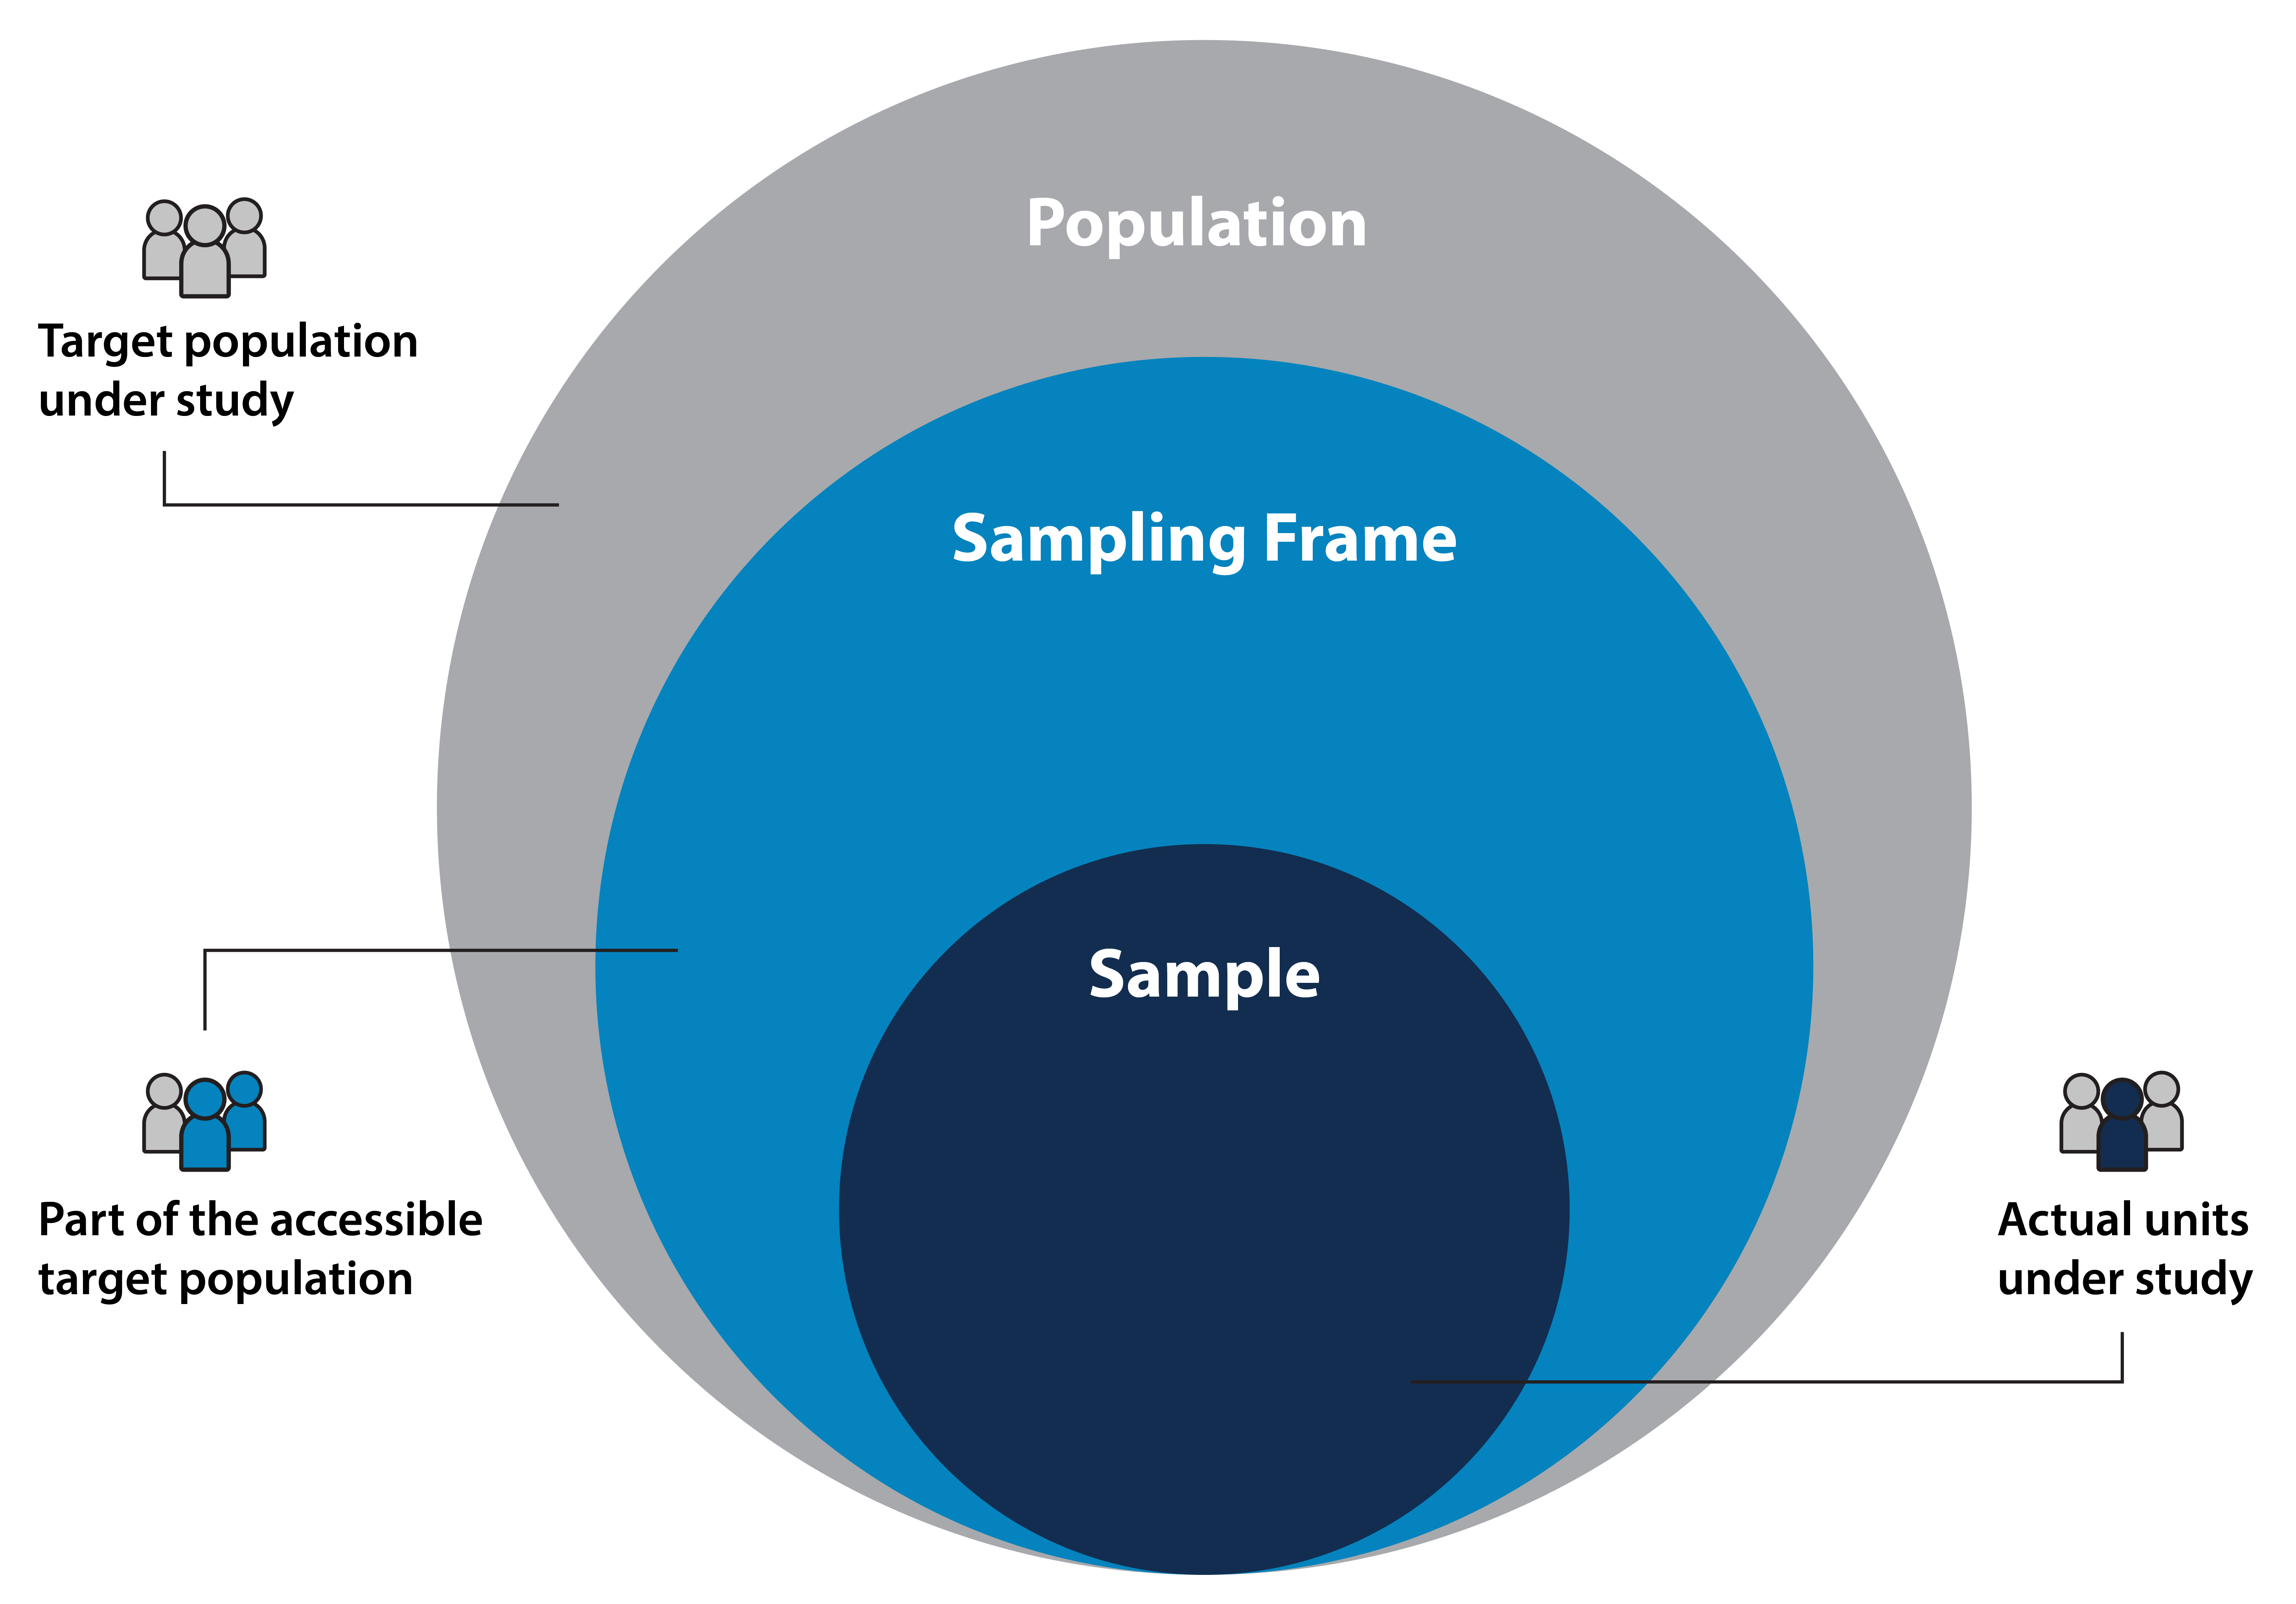
Population, Sampling Frame, Sample2
Sampling is the method you use to pick individuals out of the group to study. This can be done by random, by convenience or even self-selected. The goal of sampling is to approximate the characteristics that are relevant to the research question about a larger population. The sample must be representative so that researchers can make inferences about the larger population.
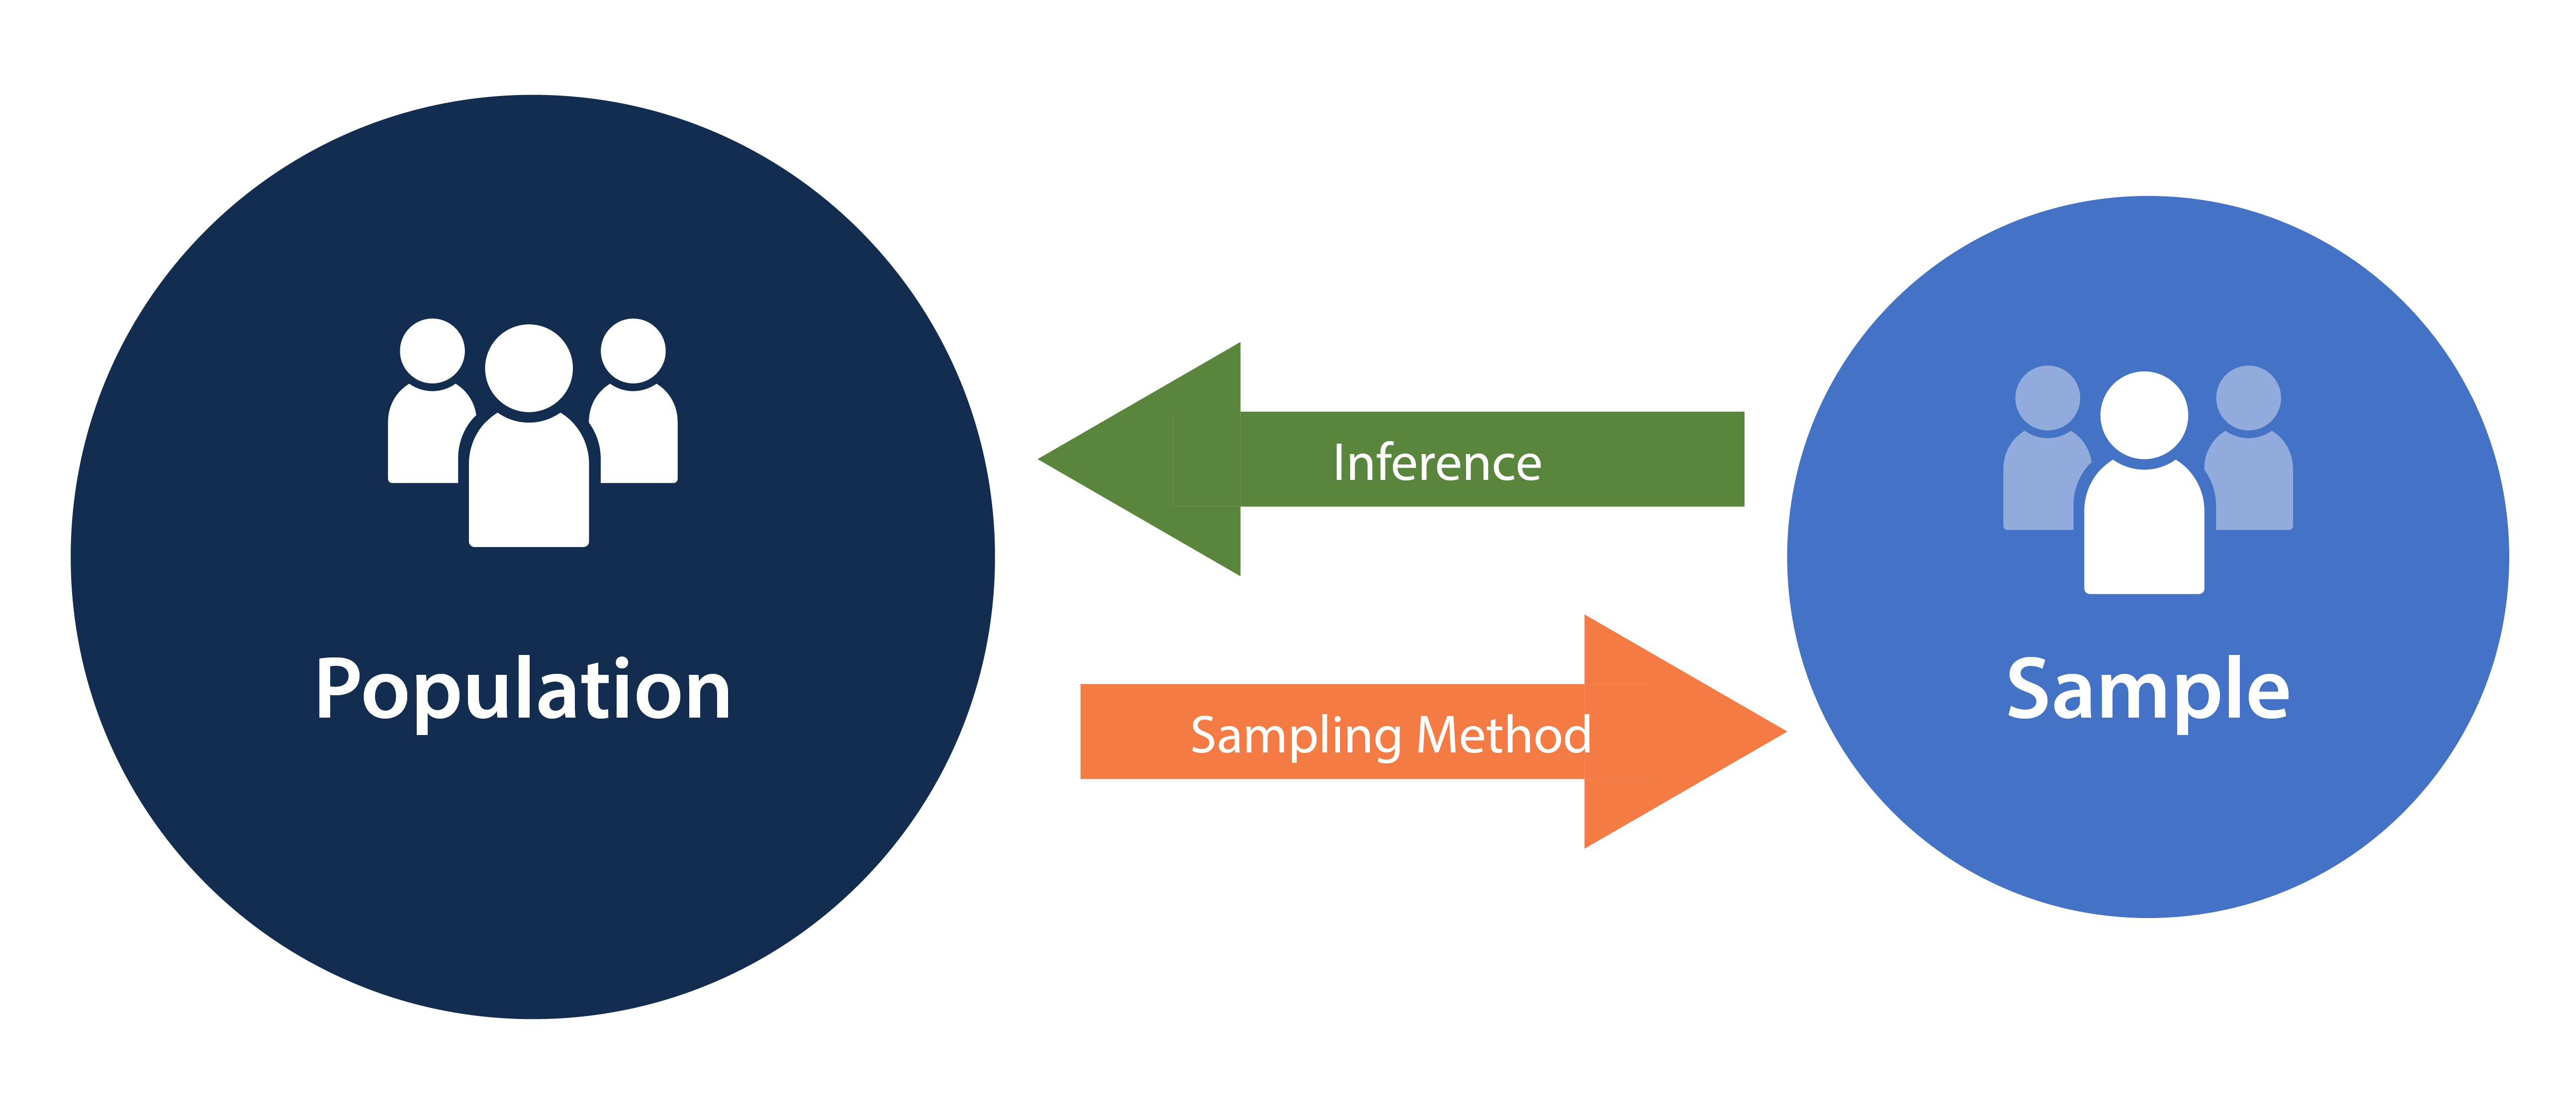
Below is a diagram showing the connection between population and sample size. From the population, we take a sampling to create the sample size. Then, from the sample size, we can make inferences about the population if the sample is representative of the population. When you have studied your sample you infer that what you have learned applies to the whole population. If your sample is representative, or very similar to the population, you have a strong case to say that the same things you found in the sample also apply in the population.
For example, if a researcher is studying Alzheimer’s Disease and dementia in United States, the entire United States would be the population. Since it is not practical to contact every person in the United States, researchers will need to select a sample that represents as close as possible the entire United States population in various import risk factors including age, sex, and race/ethnicity. If, for example, researchers only selected people for the sample from Florida, a state with one of the largest percentages of individuals over the age of 653, the results from the study should not be used to make inferences about the entire United States populations. The reverse is also true. If researchers had selected a state with a mainly younger population, then the results should not be used to make inferences about the entire United States population.
There are many types of sampling methods, but most sampling falls into two main categories: probability sampling and non-probability sampling.
Probability Sampling
Probability sampling involves random selection, and each person in the group or community has an equal chance of being chosen. In statistical theory based on probability, this means that the sample is more likely to resemble the larger population and thus more accurate inferences can be made about the larger population.
Non-Probability Sampling
Non-probability sampling does not involve random selection and so cannot rely on probability to ensure that it is representative of the population of interest. Researchers use non-probability sampling because in many cases, probability sampling is not practical, feasible, cost effective, or ethical.
Sampling Error
Researchers also should be aware of sampling error. Sampling error is the approximate difference between the results from a sample of people from a larger group, and the likely results of studying every single person in that group. In general, the larger the sample size, the smaller the sampling error. Because it is impossible to know the sampling error exactly, all sampling errors are approximate and are based on what variability is seen using calculations like standard deviation or standard error.
1. Kelley, K., Clark, B., Brown V., and J. Sitzia. "Good Practice in the Conduct and Reporting of Survey Research." International Journal for Quality in Health Care, 15 (3): 261-266. 2003.
2. Khandelwal, Akansha. "A Complete Guide on Sampling Techniques for Data Science." Analytics Vidhya, 14 Oct. 2021, www.analyticsvidhya.com/blog/2021/09/a-complete-guide-on-sampling-techniques/.
3. "2020 Profile of Older Americans." ACL Administration for Community Living, May 2021, https://acl.gov/sites/default/files/aging%20and%20Disability%20In%20America/2020Profileolderamericans.final_.pdf.