1. About Health Statistics
Knowledge Check
Exercises
Now it’s time to see what you learned! You can retake the knowledge check as many times as you want, and then move on to Module 2.
- In 2019, 25.8 percent of adults in the U.S. engaged in binge drinking in the past month.1 What category of health information is this?
- In 2019, the ratio of the total population to the number of primary care physicians in New York State was 1,180:1.2 What category of health information is this?
- The mortality rate for Alzheimer’s Disease was 37.0 per 100,000 people in 2019.3 What category of health information is this?
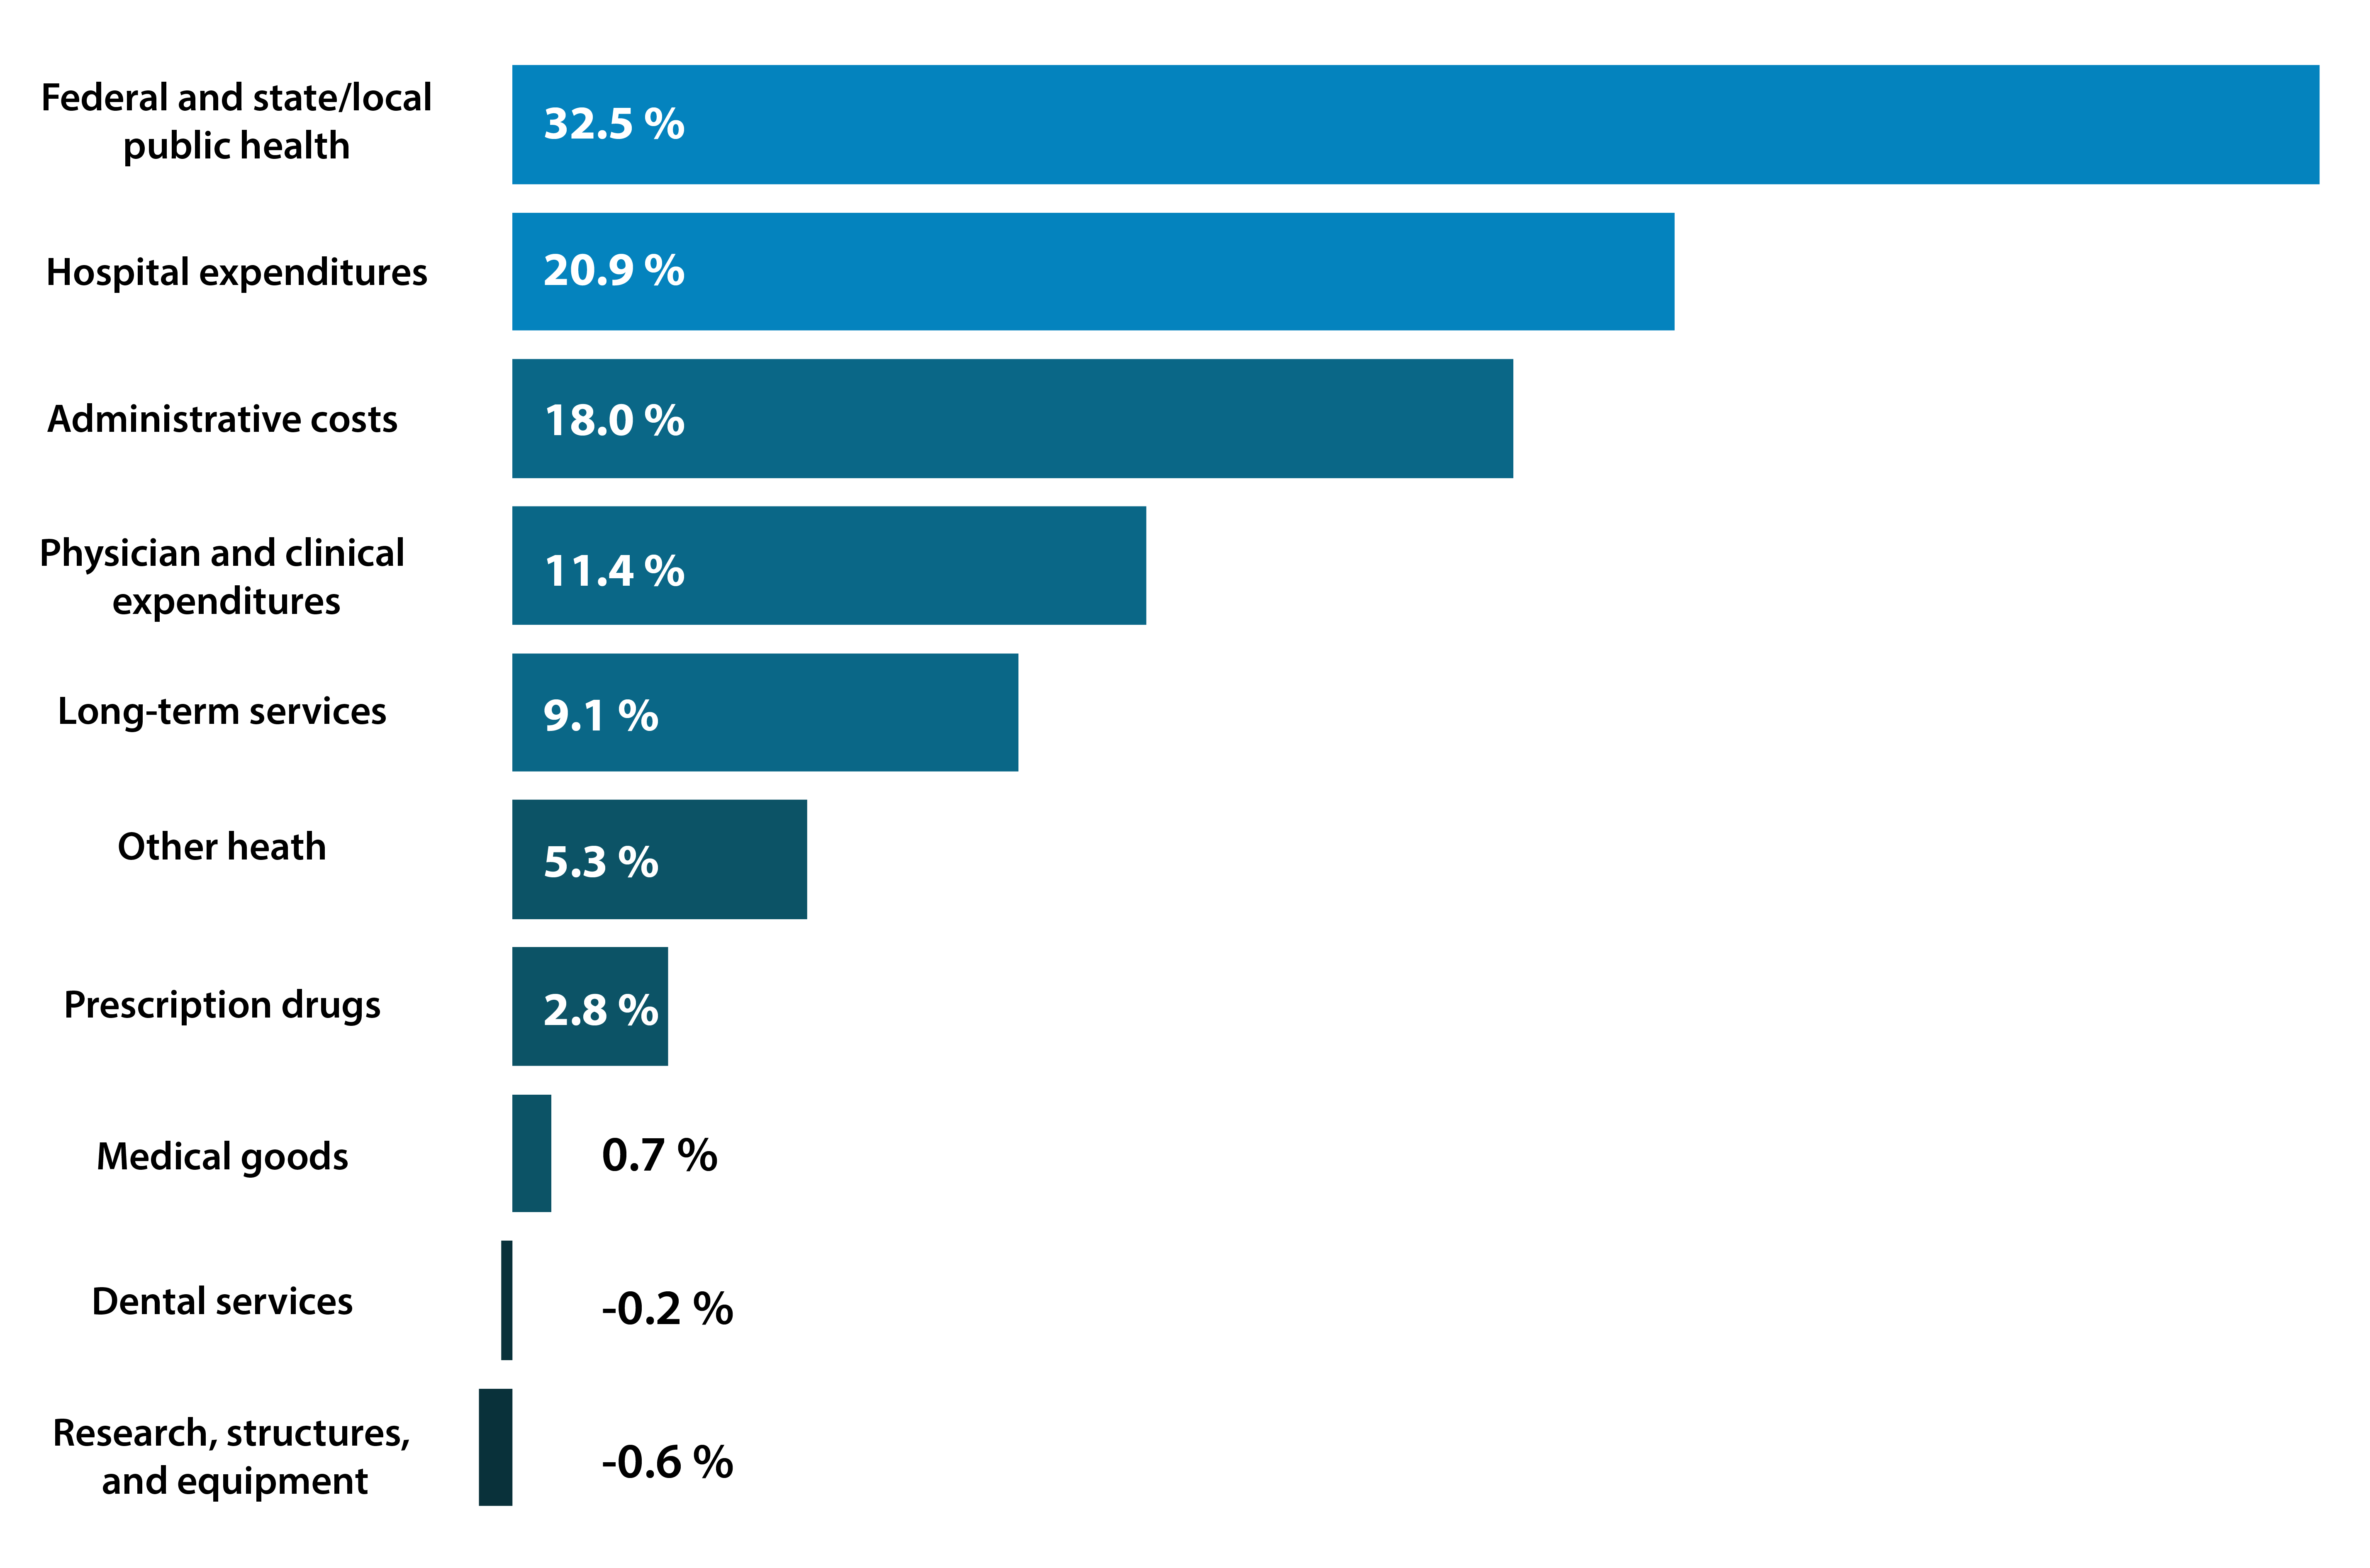
- The data presented in this graph of the contribution to change in total national health expenditures from 2019–20204, falls under the category of:
Contribution to change in total national health expenditures, from 2019-2020, by spending category
For questions 5-7, calculate prevalence risk, incidence risk, or mortality rate per 100,000 people or as a percentage.
- In a population of 500,000 people, 18,000 were diagnosed with diabetes during a period of one year. What is the period prevalence of diabetes per 100,000 people for a year?
- In a population of 1 million, 3000 people had Disease X in 2021. 150 people died of Disease X between 2021 and 2022, while the rest continued to suffer from the disease. In 2022, there were 3,250 people with Disease X. What is the incidence risk per 100,000 people for Disease X in 2022?
(Assume that the population remained about the same between 2021 and 2022, and that the entire population is at risk for the disease.)
- There are 2.5 million people aged 75-84 in Country X, which has a total population of 25 million. 4000 people died of influenza and pneumonia in Country X in 2021. 2,540 of these deaths occurred in the 75-84 age group. What is the 2021 mortality rate for influenza and pneumonia among people in Country X aged 75-84?
1. "Alcohol Use in the United States: Age Groups and Demographic Characteristics." National Institute on Alcohol Abuse and Alcoholism, www.niaaa.nih.gov/alcohols-effects-health/alcohol-topics/alcohol-facts-and-statistics/alcohol-use-united-states-age-groups-and-demographic-characteristics.
2. "New York." County Health Rankings & Roadmaps, www.countyhealthrankings.org/explore-health-rankings/new-york?year=2022&measure=Primary%2BCare%2BPhysicians.
3. "2021 Alzheimer’s Disease Facts and Figures." Alzheimer’s & Dementia, vol. 17, no. 3, Mar. 2021, pp. 327–406, https://alz-journals.onlinelibrary.wiley.com/doi/10.1002/alz.12328.
4. Telesford, Imani, et al. "How Has U.S. Spending on Healthcare Changed over Time?" Peterson-KFF Health System Tracker, 7 Feb. 2023, www.healthsystemtracker.org/chart-collection/u-s-spending-healthcare-changed-time/#Total%20national%20health%20expenditures,%20US%20$%20Billions,%201970-2021.