2. Common Terms and Equations
Standard Deviation
A standard deviation (or σ) is a measure of how dispersed the data is in relation to the mean. Low, or small, standard deviation indicates data are clustered tightly around the mean, and high, or large, standard deviation indicates data are more spread out. A standard deviation close to zero indicates that data points are very close to the mean, whereas a larger standard deviation indicates data points are spread further away from the mean.
In the image, the curve on top is more spread out and therefore has a higher standard deviation, while the curve below is more clustered around the mean and therefore has a lower standard deviation.1

Example Standard Deviation Curves
To calculate the standard deviation, use the following formula:
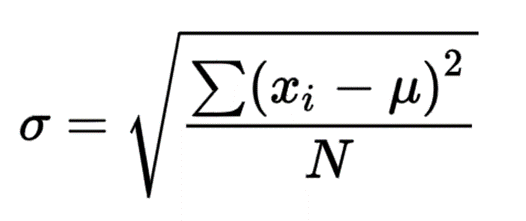
In this formula, σ is the standard deviation, xi is each individual data point in the set, µ is the mean, and N is the total number of data points. In the equation, xi, represents each individual data point, so if you have 10 data points, subtract x1 (first data point) from the mean and then square the absolute value. This process is continued all the way through x10 (last data point). The results are then summed (symbolized as Σ), which is the numerator of the fraction from the equation.
Let’s go back to the class example, but this time look at their height. To calculate the standard deviation of the class’s heights, first calculate the mean from each individual height. In this class, there are nine students with an average height of 75 inches. Now the standard deviation equation looks like this:
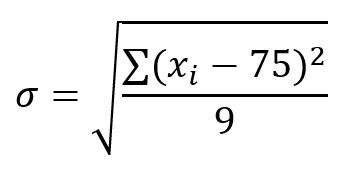
The first step is to subtract the mean from each data point. Then square the value before adding them all together. Now divide by 9 (the total number of data points) and finally take the square root to reach the standard deviation of the data:
| Height in inches xi |
Mean µ |
Subtract mean from each data point x - µ |
Result x |
Square each value x2 |
Sum of Squares ∑ x |
Variance x Ν |
Standard Deviation σ=√x |
|---|---|---|---|---|---|---|---|
| 56 | 75 | 56 – 75 | -19 | 361 | 784 | 87.1 | 9.3 |
| 65 | 65 – 75 | -10 | 100 | ||||
| 74 | 74 – 75 | -1 | 1 | ||||
| 75 | 75 – 75 | 0 | 0 | ||||
| 76 | 76 – 75 | 1 | 1 | ||||
| 77 | 77 – 75 | 2 | 4 | ||||
| 80 | 80 – 75 | 5 | 25 | ||||
| 81 | 81 – 75 | 6 | 36 | ||||
| 91 | 91 – 75 | 16 | 256 |
This data shows that 68% of heights were 75 inches plus or minus 9.3 inches (1 standard deviation away from the mean), 95% of heights were 75’’ plus or minus 18.6’’ (2 standard deviations away from the mean), and 99.7% of heights were 75’’ plus or minus 27.9’’ (3 standard deviations away from the mean).
1. "Image 7: High and low standard deviation curves" Density Curves and Normal Distributions. University of North Carolina, 2012.