1. About Health Statistics
Care
Health care statistics reveal a lot about the state of health care systems and services, including who has access to health care, the quality of the care people get, and a variety of data on patients, providers, diagnoses, medications, and patient satisfaction. Researchers often study data about a group of patients (i.e., patients of a certain age or race) or about a group of hospitals in a certain location.
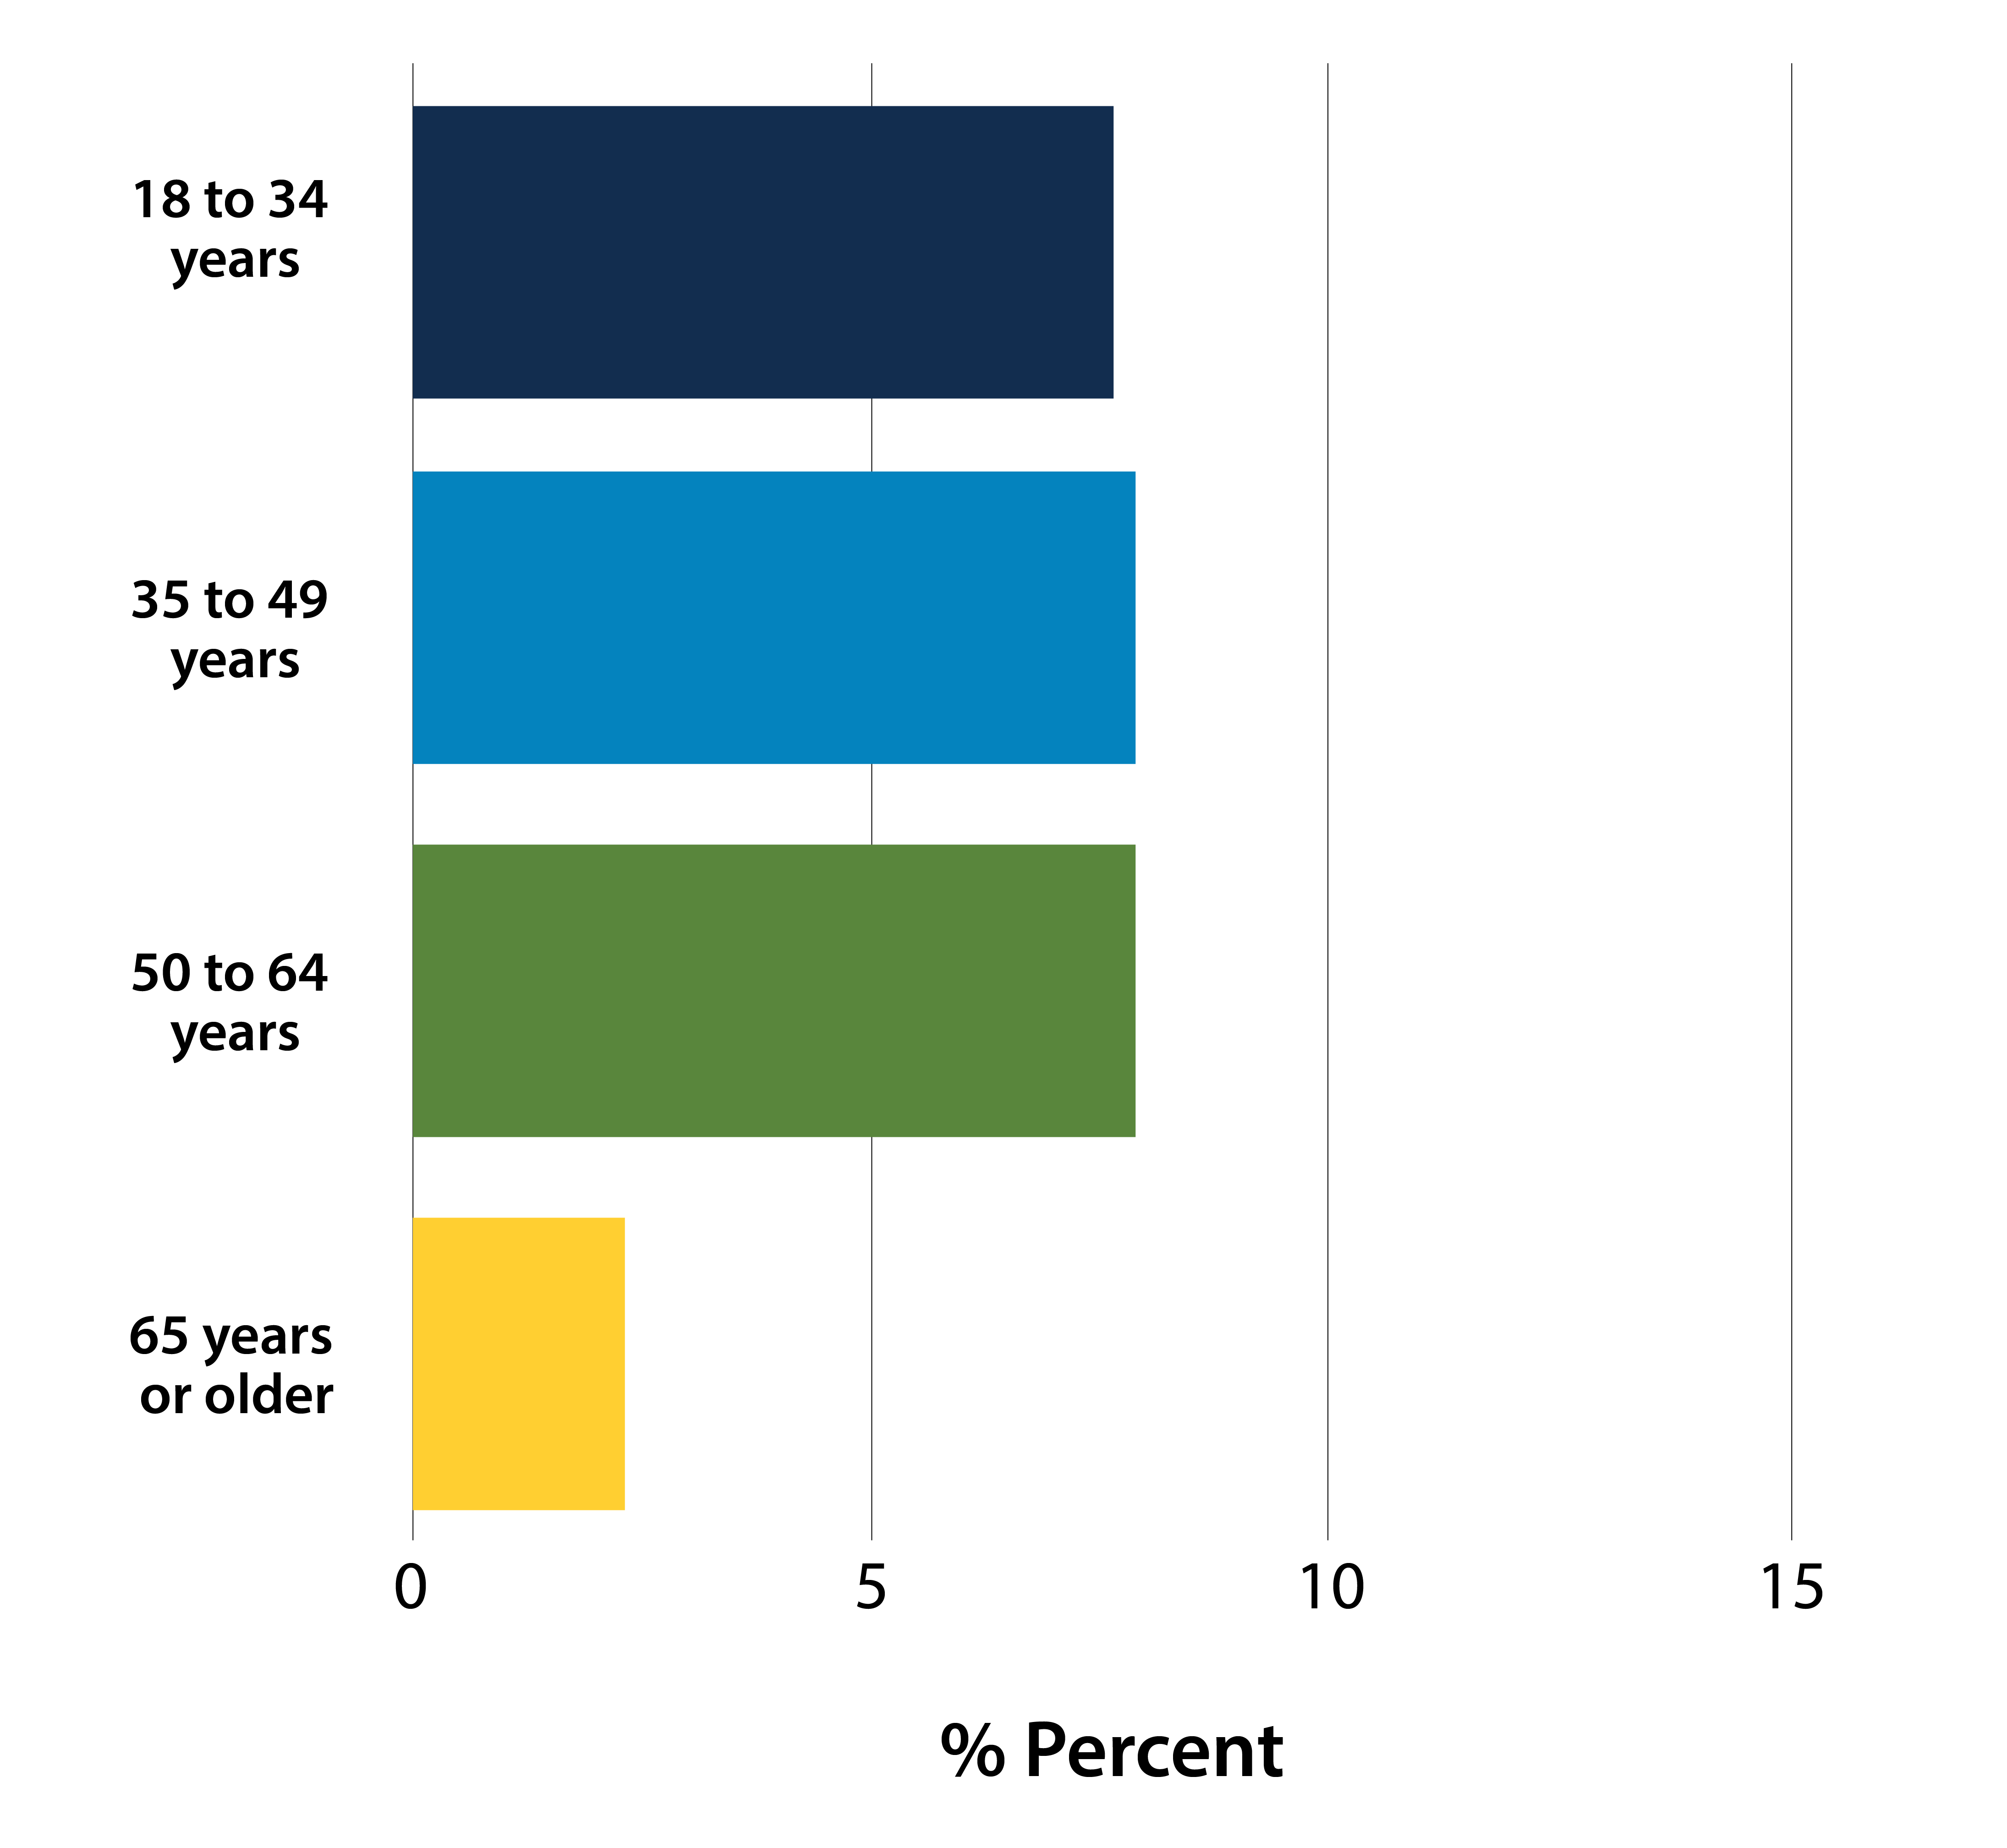
The graph below shows an example related to access to health care. The graph displays the percentage of adults by age group in the United States for who did not receive necessary medical care due to cost. From this graph, the percentage of adults who did receive medical care due to cost was relatively even across age groups of 18 to 34 years old, 35 to 39 years old, and 50 to 64 years old (>5%). However, the percentage appears to be lower (<5%) in those 65 years old and older. Although more data is needed before reaching a conclusion, the lower percentage for those 65 years old or older could be related to more extensive access to health insurance (e.g., Medicare) than other age groups.
Percentage of adults aged 18 and over who did not get needed medical care due to cost in the past 12 months, United States, 20231
Data Disaggregation
Data disaggregation, or separating data into measures or variables of interest, is essential to revealing differences across groups or categories within a set of data. For example, one may expect to find differences in measures of health outcomes between elderly and young adult populations. Disaggregated data allows for analysis of these differences. However, sometimes only aggregated data are available for use. With the correct research question, aggregated data can be useful in health research as well, especially in the absence of data disaggregated by groups or individual level (disaggregated) data. For example, analyzing the relationship between the percentage of people with asthma in a county and the air quality can inform county health departments’ education and awareness programs for air quality alert days.
Another specific type of difference concerns health inequities, or health disparities. These are health differences based on historic and systematic social inequities2.
Health Disparities
“Differences in health outcomes and health care that are closely linked with social, economic, and environmental disadvantage”3
Americans experience variable access to and quality of care based on race, ethnicity, socioeconomic status, age, sex, disability status, and residential location.4
The National Healthcare Quality and Disparities Report (QDR) is a congressionally mandated annual publication of the Agency for Healthcare Research and Quality (AHRQ) that monitors trends in progress in improving health care access, quality, and disparities in the U.S. The 2023 QDR finds that overall access to care has improved. However, disparities in access to health and dental insurance by race, ethnicity, household income, and location still persist. The QDR includes a series of charts with the latest findings on quality of and access to health care.
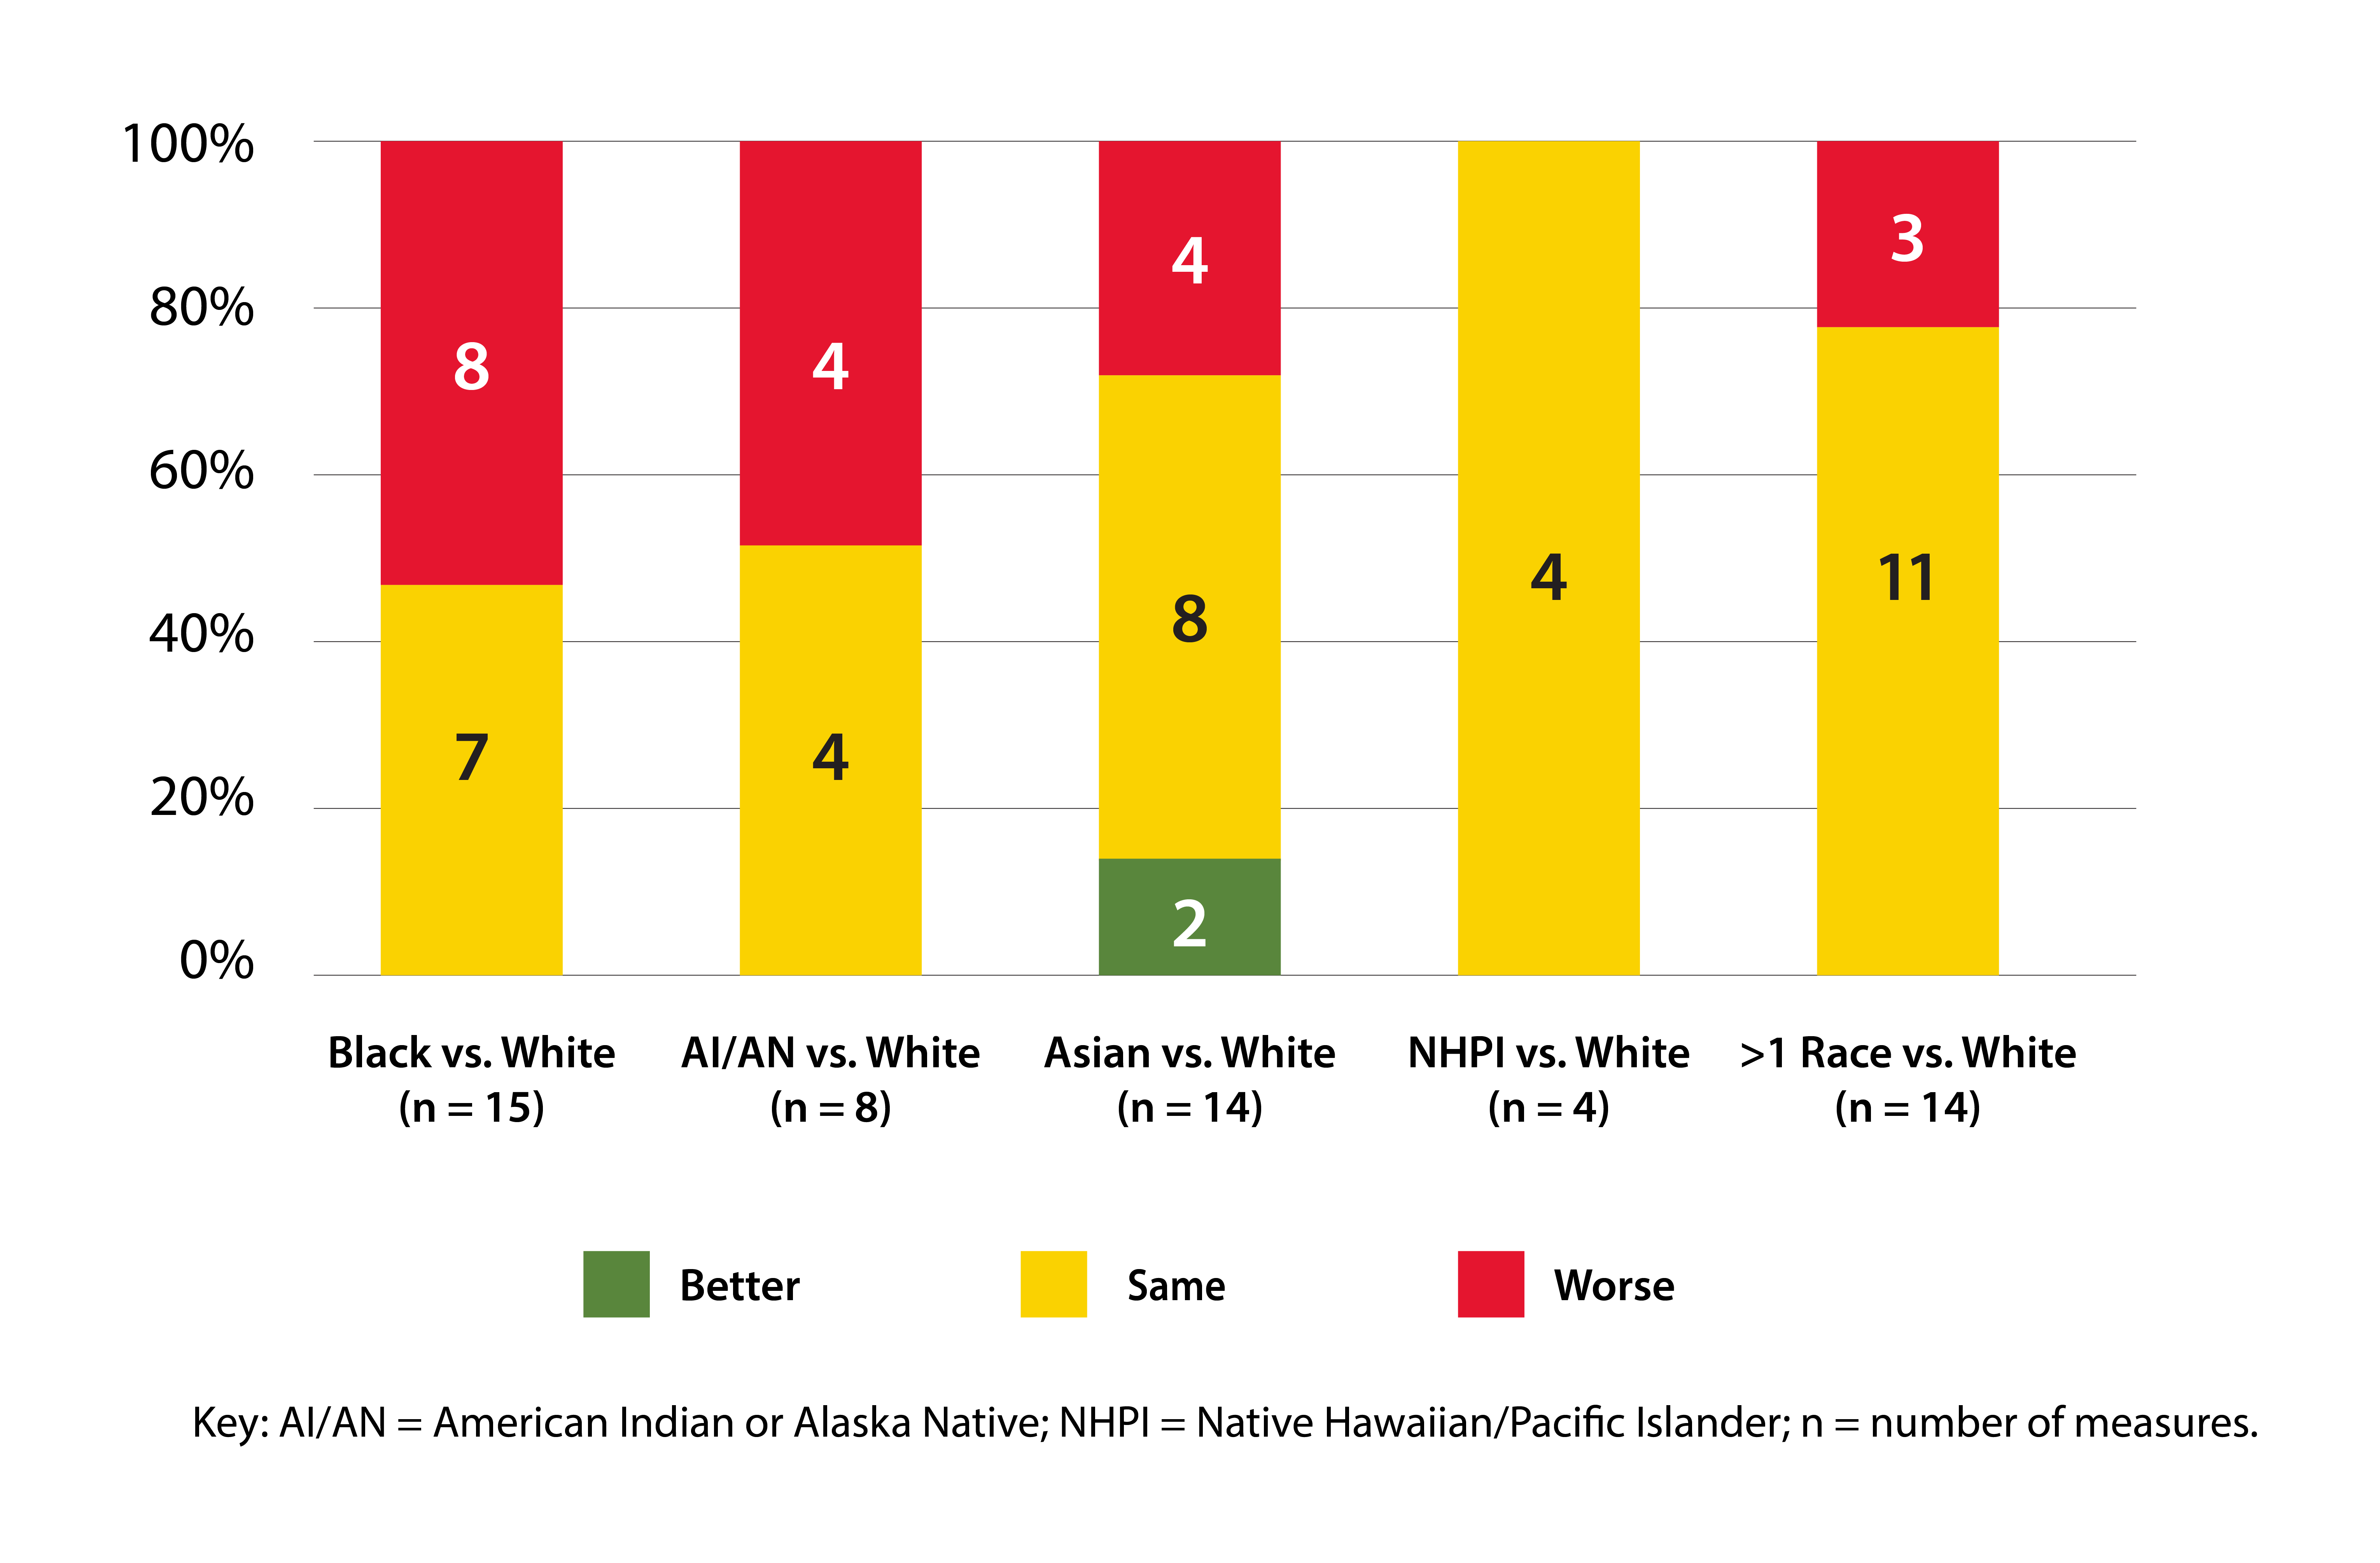
The figure below shows differences in a number of access measures between Whites and other racial minority groups. It may be used to illustrate health disparities related to race. From the figure, we can see that Black people had worse access to care than White people for 47% of access measures.
Number and percentage of access measures for which members of selected race and ethnicity groups experienced better, same, or worse access to care compared with non-Hispanic White or White people for the most recent data year, 2019, 2020, or 20215
1. National Center for Health Statistics. Percentage of adults aged 18 and over who did not get needed medical care due to cost in the past 12 months, United States, 2023. National Health Interview Survey. Generated interactively: Jan 16 2025 from https://wwwn.cdc.gov/NHISDataQueryTool/SHS_adult/index.html
2. "Executive Summary." 2021 National Healthcare Quality and Disparities Report. Agency for Healthcare Research and Quality; December 2021. AHRQ Pub. No. 21(22)-0054-EF. Available from: https://www.ahrq.gov/research/findings/nhqrdr/nhqdr21/index.html
3. Braveman, P. What Are Health Disparities and Health Equity? We Need to Be Clear. Public Health reports, 129(Suppl 2), 5-8. 2014.
4. A Nation Free of Disparities in Health and Health Care: HHS Action Plan to Reduce Racial and Ethnic Health Disparities. Department of Health and Human Services, 2011, page 1.
5. 2023 National Healthcare Quality and Disparities Report. Appendix D. Quality and Disparities Summary Charts. Figure 1. Number and percentage of access measures for which members of selected race and ethnicity groups experienced better, same, or worse access to care compared with non-Hispanic White or White people for the most recent data year, 2019, 2020, or 2021. Agency for Healthcare Research and Quality; December 2023. AHRQ Pub. No. 23(24)-0091-EF. https://www.ahrq.gov/sites/default/files/wysiwyg/research/findings/nhqrdr/2023-NHQDR-appendixes-ACDE-rev.pdf