2. Common Terms and Equations
Significance Level
The phrase statistically significant indicates if a result is different enough that it is unlikely to be the result of random chance. In comparing the average height of students in the class to the average height of students in the entire school, a statistically significant result indicates that the class mean height is different enough from the school mean height that observed difference is not likely to be the result of random chance.
In statistical tests, statistical significance is determined by citing an alpha level, or the probability of rejecting the null hypothesis when the null hypothesis is true. For this example, alpha, or significance level, is set to 0.05 (5%).
The calculated t-value like the one calculated in the previous section can be used to test the original hypotheses and determine statistical significance. The next step is calculating the degrees of freedom for the test, which are calculated as the sample size – 1 for the t-test. Degrees of freedom is a common statistical term, especially when determining statistical significance, and they represent the number of values that are allowed to vary when estimating the statistic.1
Once the t-value and degrees of freedom are calculated, then look at a t-table and find the value associated with 8 degrees of freedom (sample size – 1) and our alpha level of 0.05. Because the test determines statistical difference between sample mean (class) and population mean (class), this is considered a two-tailed test. For this reason, the alpha level is divided in half (0.05/2 = 0.025) and then located on the t-table2 below to find our critical value, which comes out to be 2.306.
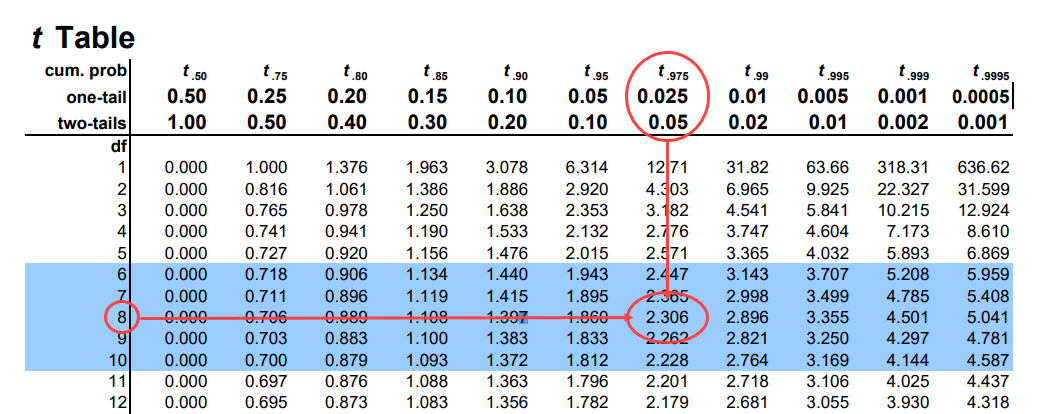
Because the t-value is lower than the critical value on the t-table, we fail to reject the null hypothesis that the sample mean and population mean are not statistically different at the 0.05 significance level. If we want to determine if the class mean height was greater than the overall school mean height, then the test would have been a one tailed test, and the alpha level would not be divided in half.
The other statistical test that could be used is a z-test, which uses the z-score shown in the previous section, but this test is only appropriate when the sample size is above 30 as the distribution can be assumed approximately normal, and the standard deviation of the population is known. The formula for the z-test is the essentially same as the t-test formula.
1. "Degrees of Freedom." The University of Texas at Austin, 2015, https://sites.utexas.edu/sos/degreesfreedom/.
2. "t-Table." San José State University, 14 July 2007, www.sjsu.edu/faculty/gerstman/StatPrimer/t-table.pdf.