3. Health Data Sources
Knowledge Check
Exercises
Now it’s time to see what you learned! If you can identify where information comes from, it will improve how well you can interpret and evaluate statistics. You can retake the knowledge check as many times as you want, and then move on to Module 4.
For questions 1–6, pick the source that best corresponds to the statistic, figure, or table.
- Pick the source that best corresponds to the statistic, figure, or table.
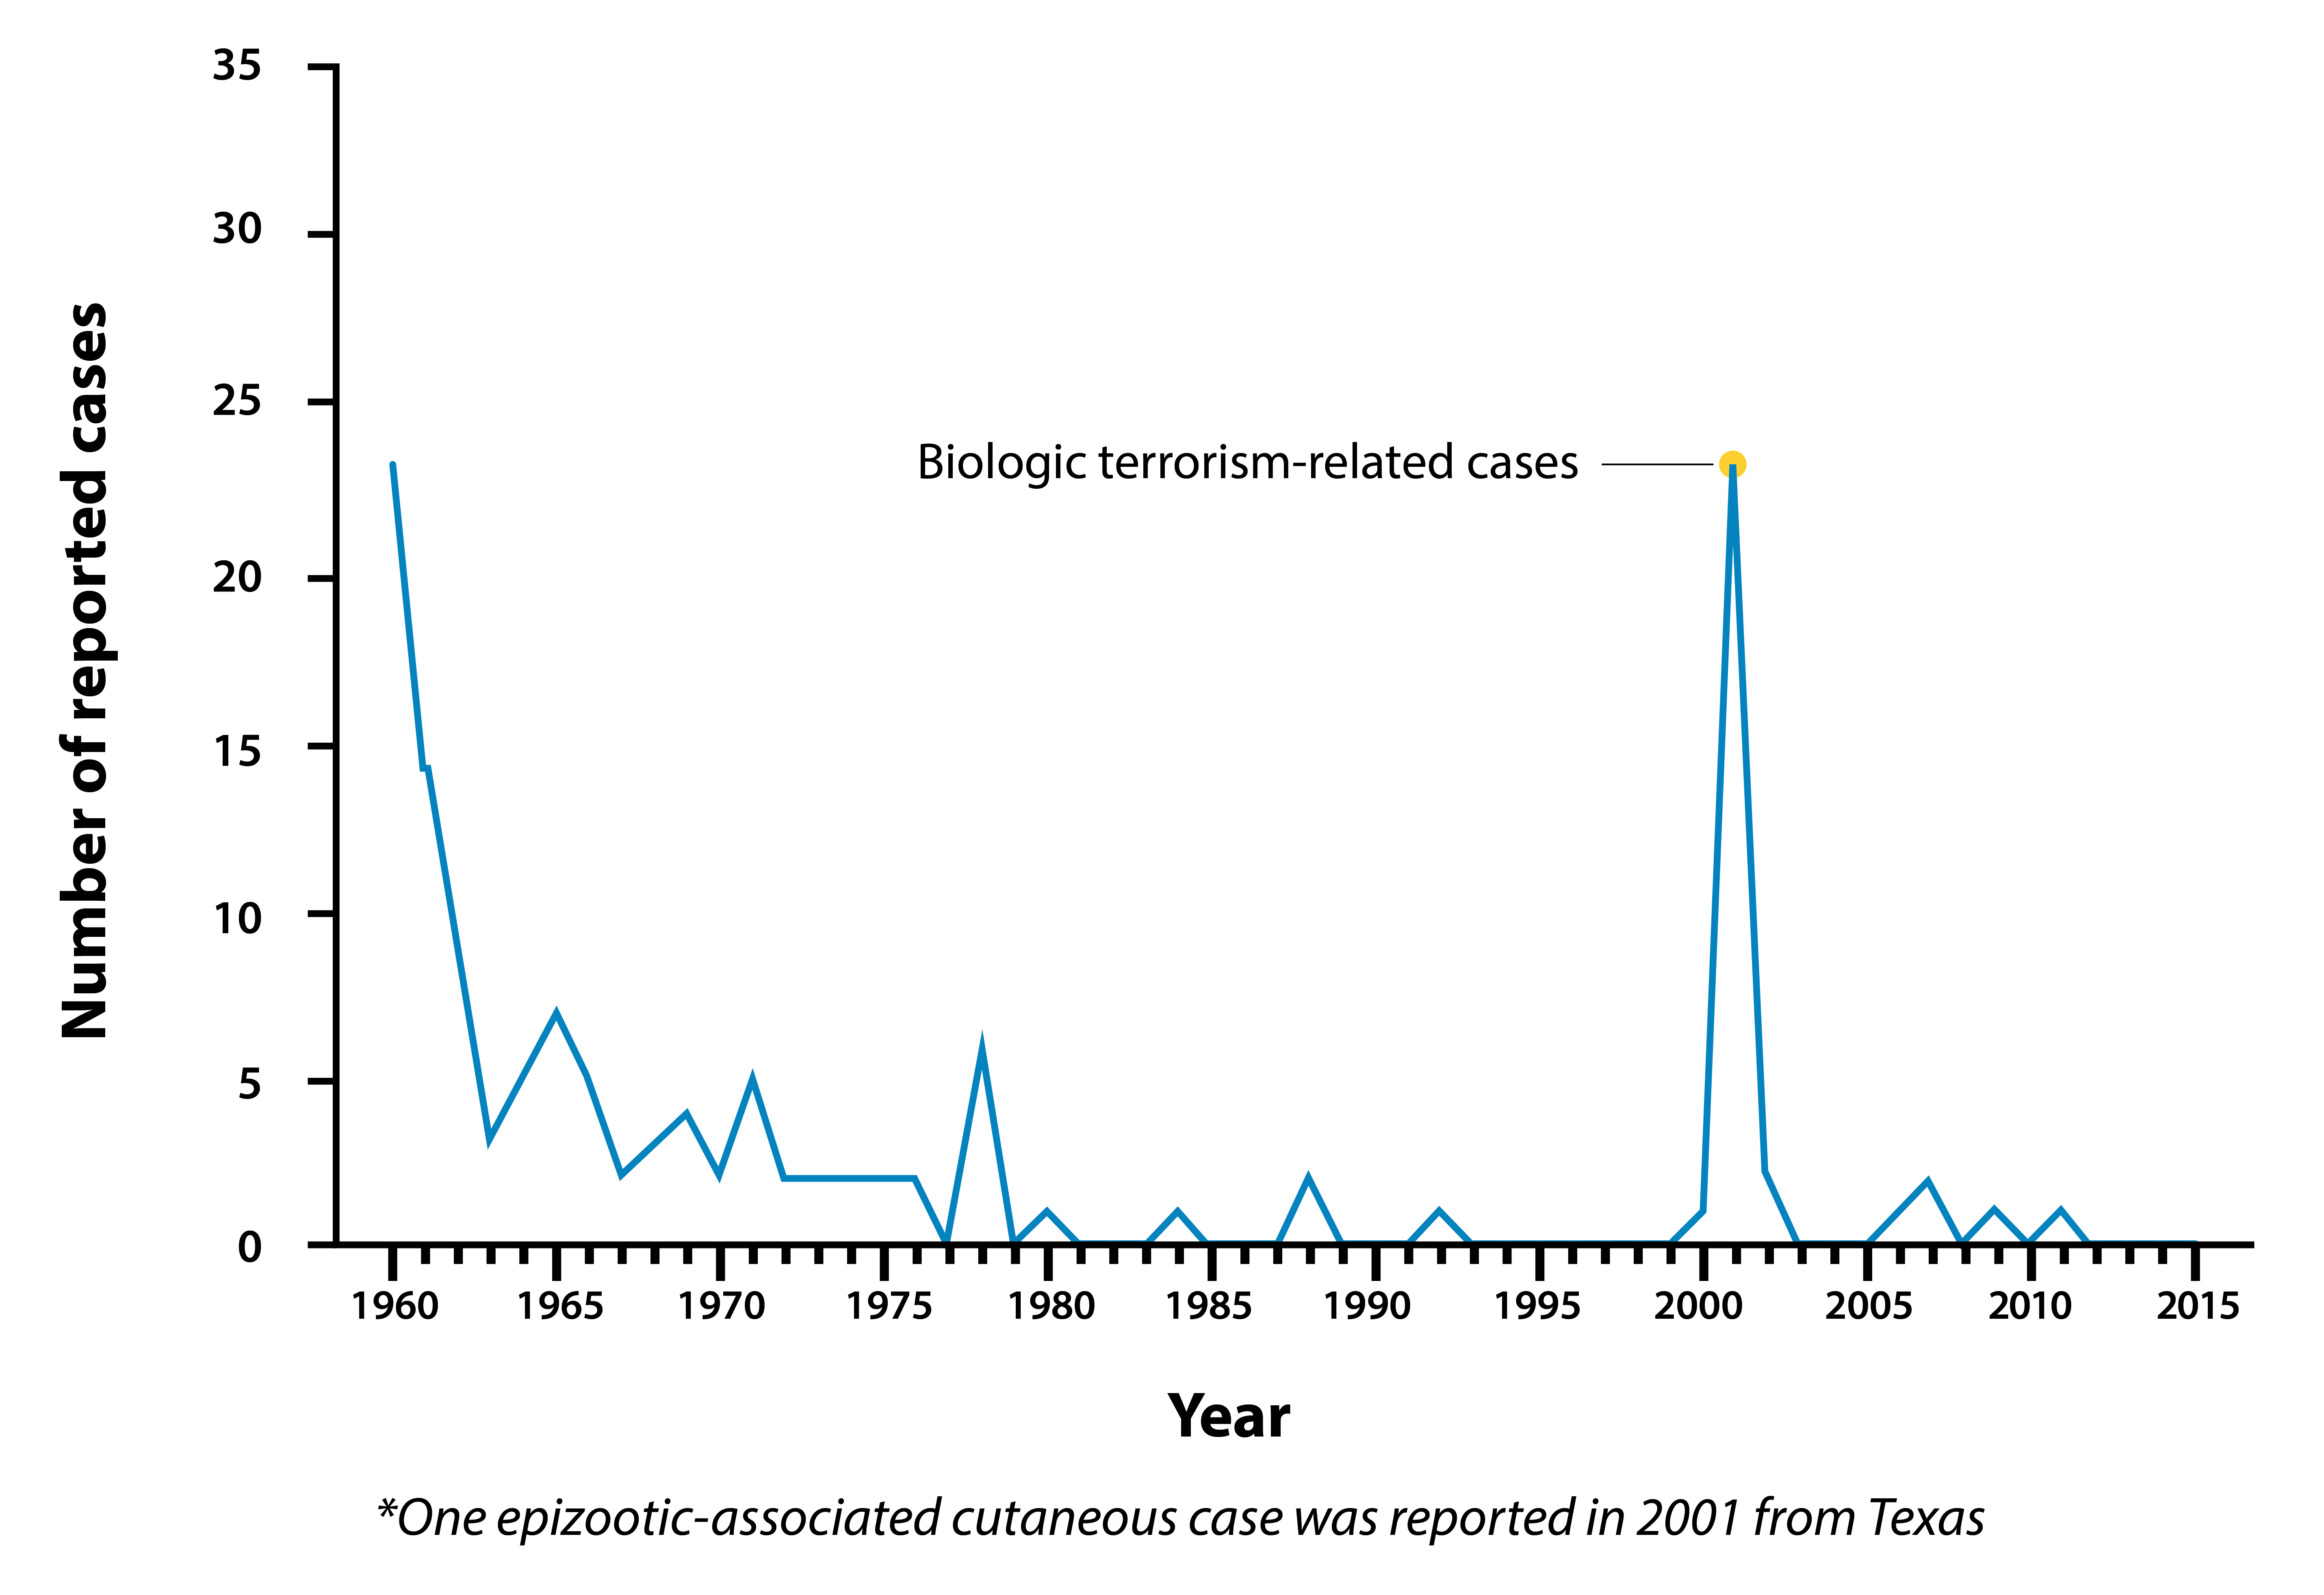
ANTHRAX. Number of reported cases, by year - United States, 1960–2015*1
- Pick the source that best corresponds to the statistic, figure, or table.
Table. Rates for congestive heart failure hospitalization, by age in years: United States, 2000 and 20102
| 2000 | 2010 | |
|---|---|---|
| Rate per 10,000 population | ||
| Total | 35.5 | 32.8 |
| Under age 65† | 9.4 | 10.8 |
| 65 and over† | 218.6 | 177.7 |
| 65–74† | 130.3 | 85.7 |
| 75–84 | 260.2 | 214.6 |
| 85 and over† | 475.9 | 430.7 |
- From 2012–2018, the lung cancer survival rate was 22.9%.3 Which is the best source that corresponds with this data?
- Pick the source that best corresponds to the statistic, figure, or table.
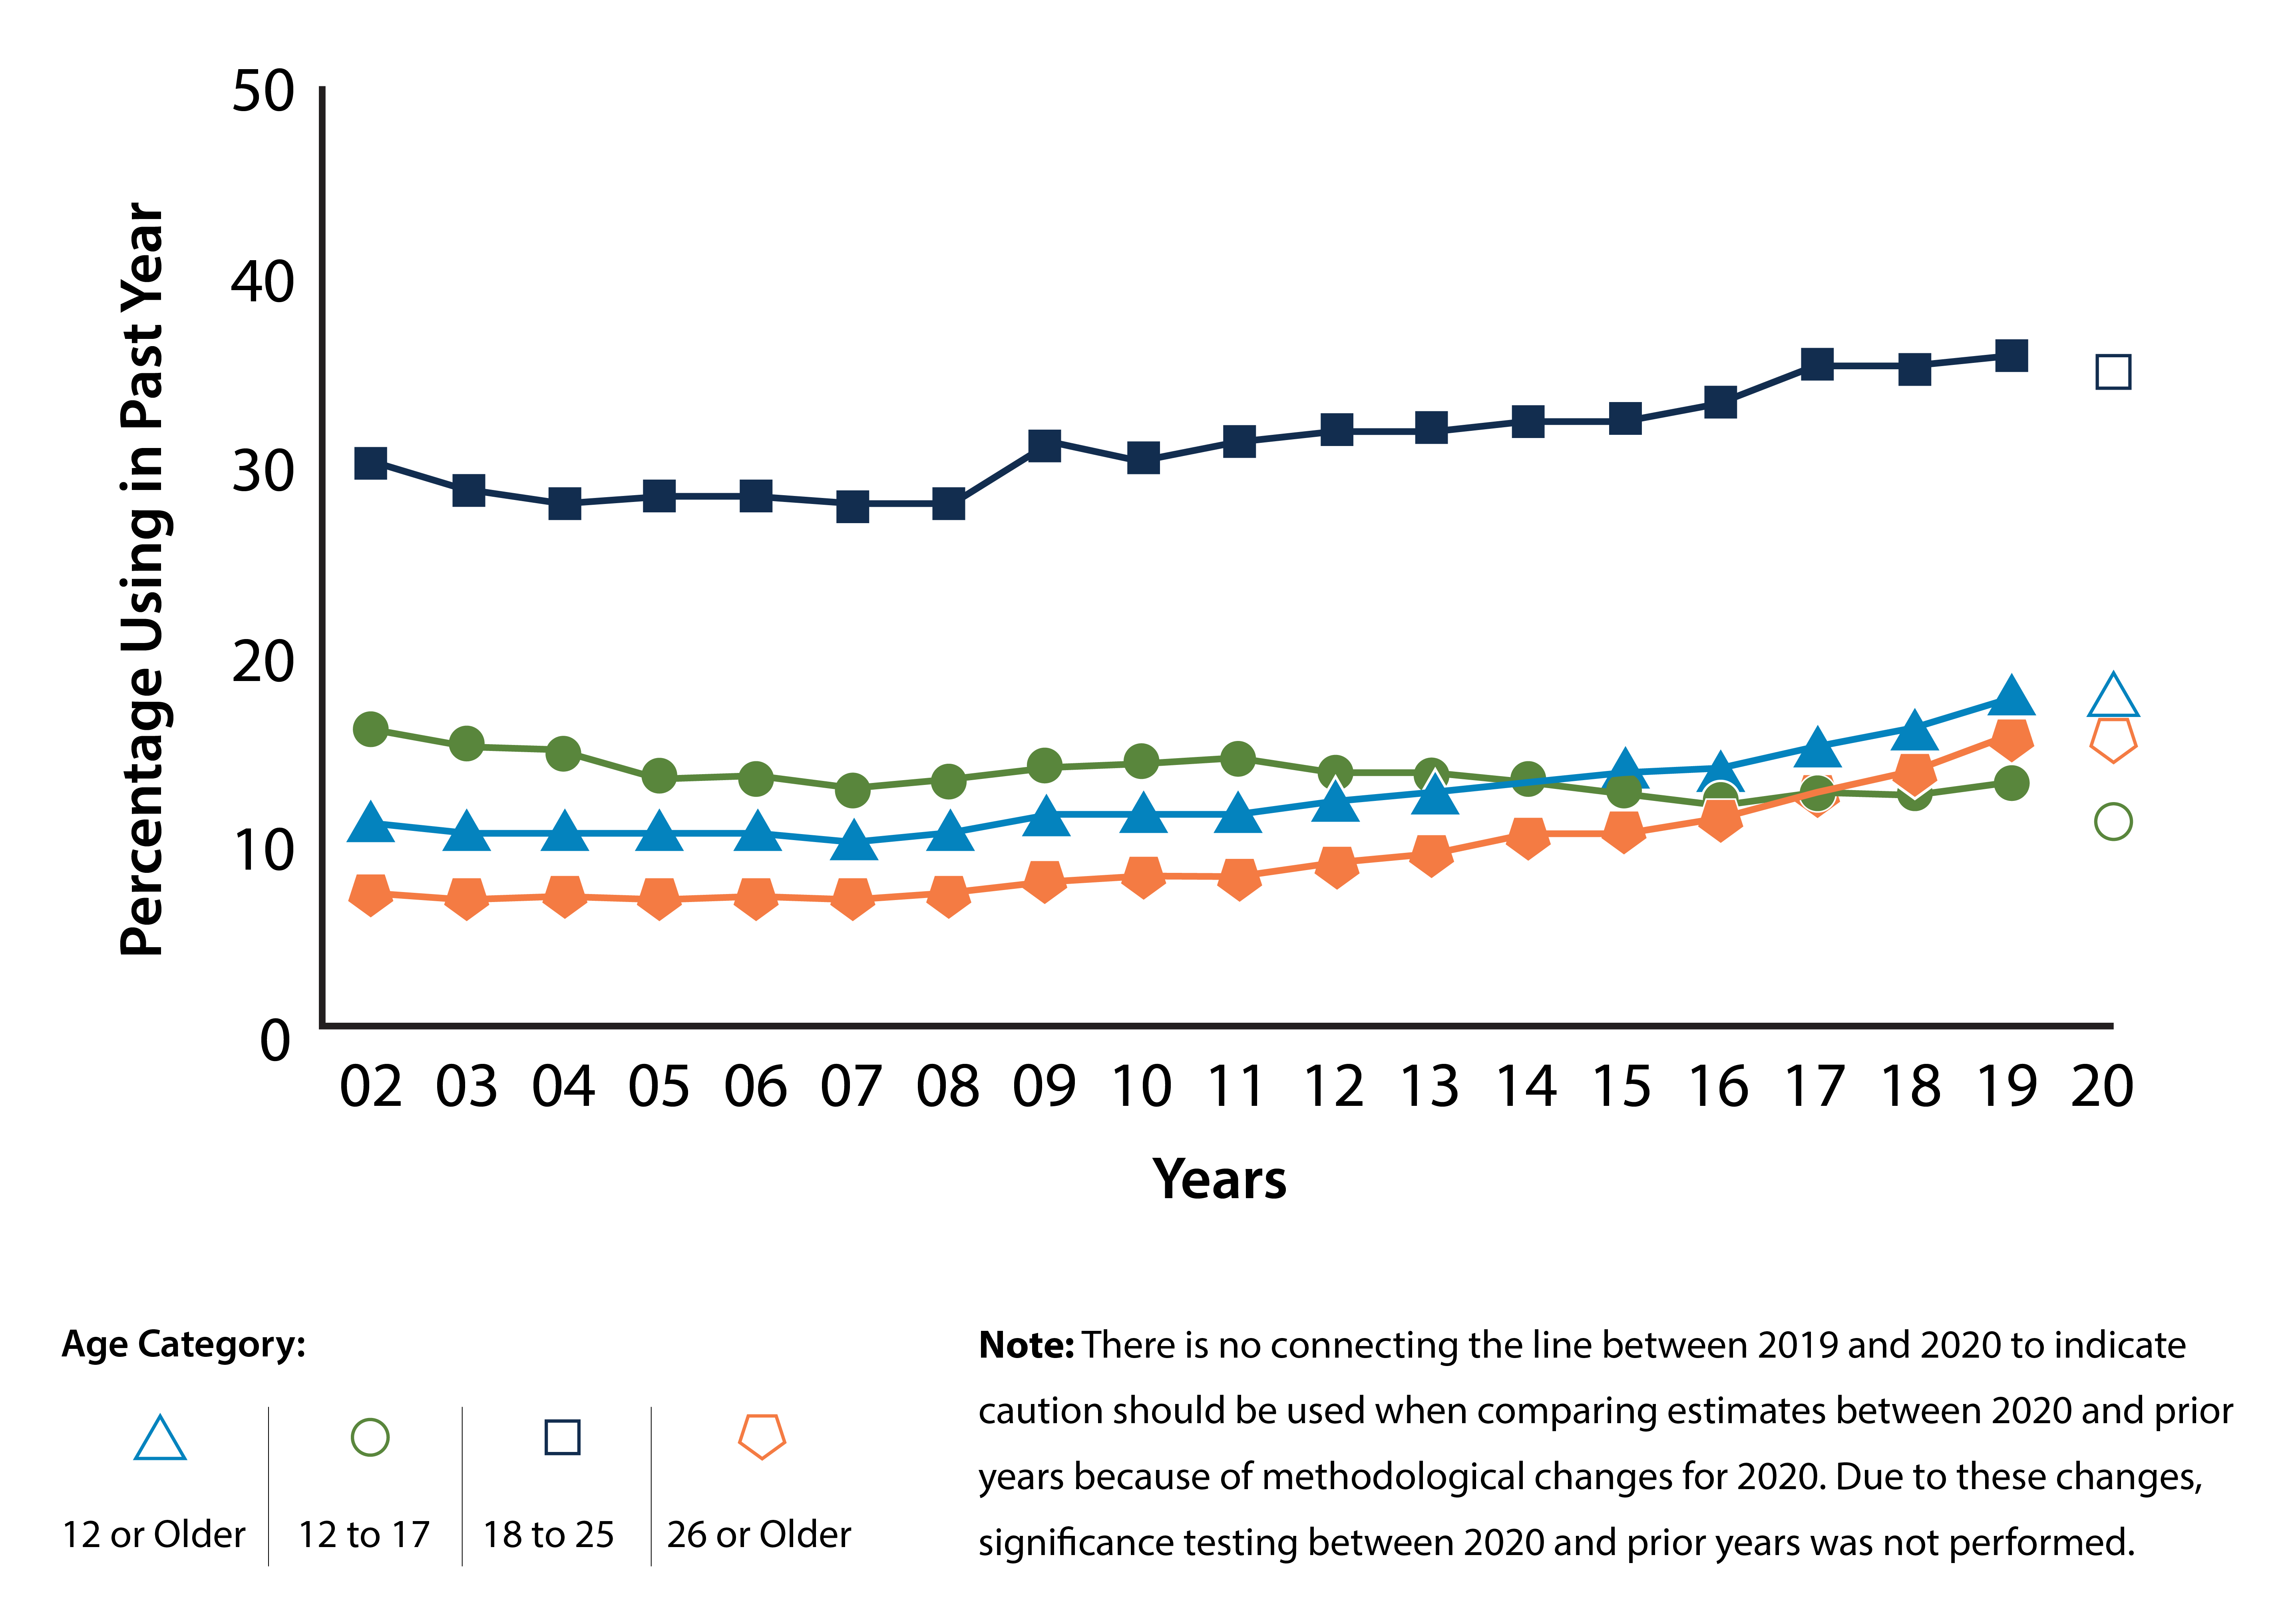
Figure 11. Past Year Marijuana Use: Among People Aged 12 or Older; 2002–20204
- Pick the source that best corresponds to the statistic, figure, or table.
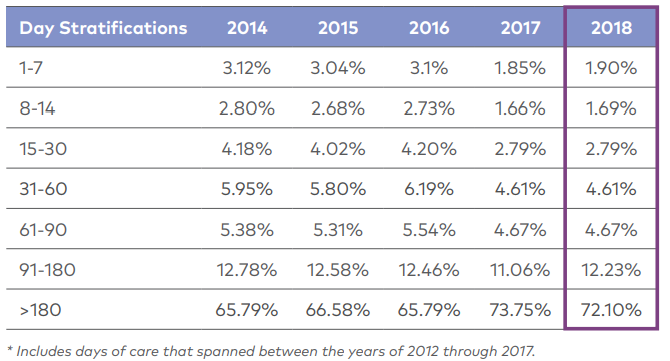
Table 5. Medicare Payments by Days of Care Stratified from 2012–20185
- In 2020, there were a total of 3,613,647 births in the United States. The birth rate for teenagers aged 15–19 fell 8% from 2019 to 2020.6 Which is the best source that corresponds with this data?
- Historically, public health surveillance has focused on _________________.
- Data from _________________ may have lower validity, compared to the others.
- Non-response is a potential bias that is unique to __________.
- ________________ comes from a direct encounter between a patient and health care provider.
1. Adams DA, Thomas KR, Jajosky RA, et al. Summary of Notifiable Infectious Diseases and Conditions — United States, 2015. MMWR Morb Mortal Wkly Rep 2017;64:1–143. https://www.cdc.gov/mmwr/volumes/64/wr/mm6453a1.htm.
2. Hall MJ, Levant S, DeFrances CJ. Hospitalization for congestive heart failure: United States, 2000–2010. NCHS data brief, no 108. Hyattsville, MD: National Center for Health Statistics. 2012. https://www.cdc.gov/nchs/products/databriefs/db108.htm
3. "Cancer of the Lung and Bronchus - Cancer Stat Facts." National Cancer Institue SEER, https://seer.cancer.gov/statfacts/html/lungb.html.
4. Substance Abuse and Mental Health Services Administration. (2021). Key substance use and mental health indicators in the United States: Results from the 2020 National Survey on Drug Use and Health (HHS Publication No. PEP21-07-01-003, NSDUH Series H-56). Rockville, MD: Center for Behavioral Health Statistics and Quality, Substance Abuse and Mental Health Services Administration. https://www.samhsa.gov/data/sites/default/files/reports/rpt35325/NSDUHFFRPDFWHTMLFiles2020/2020NSDUHFFR1PDFW102121.pdf
5. "NHPCO Facts and Figures." National Hospice and Palliative Care Organization, 20 Aug. 2020, www.nhpco.org/wp-content/uploads/NHPCO-Facts-Figures-2020-edition.pdf.
6. Martin JA, Hamilton BE, Osterman MJK. "Births in the United States, 2020." NCHS Data Brief, no 418. Hyattsville, MD: National Center for Health Statistics. 2021. DOI: https://dx.doi.org/10.15620/cdc:109213. Available from: https://www.cdc.gov/nchs/products/databriefs/db418.htm.